Waymo and Tesla Say Self-Driving Is Safer. What Independent Data Can Confirm
Waymo and Tesla both publish numbers claiming their systems beat human drivers, but the two companies measure different things, against different baselines, and NHTSA says its own crash data cannot be used to rank them.
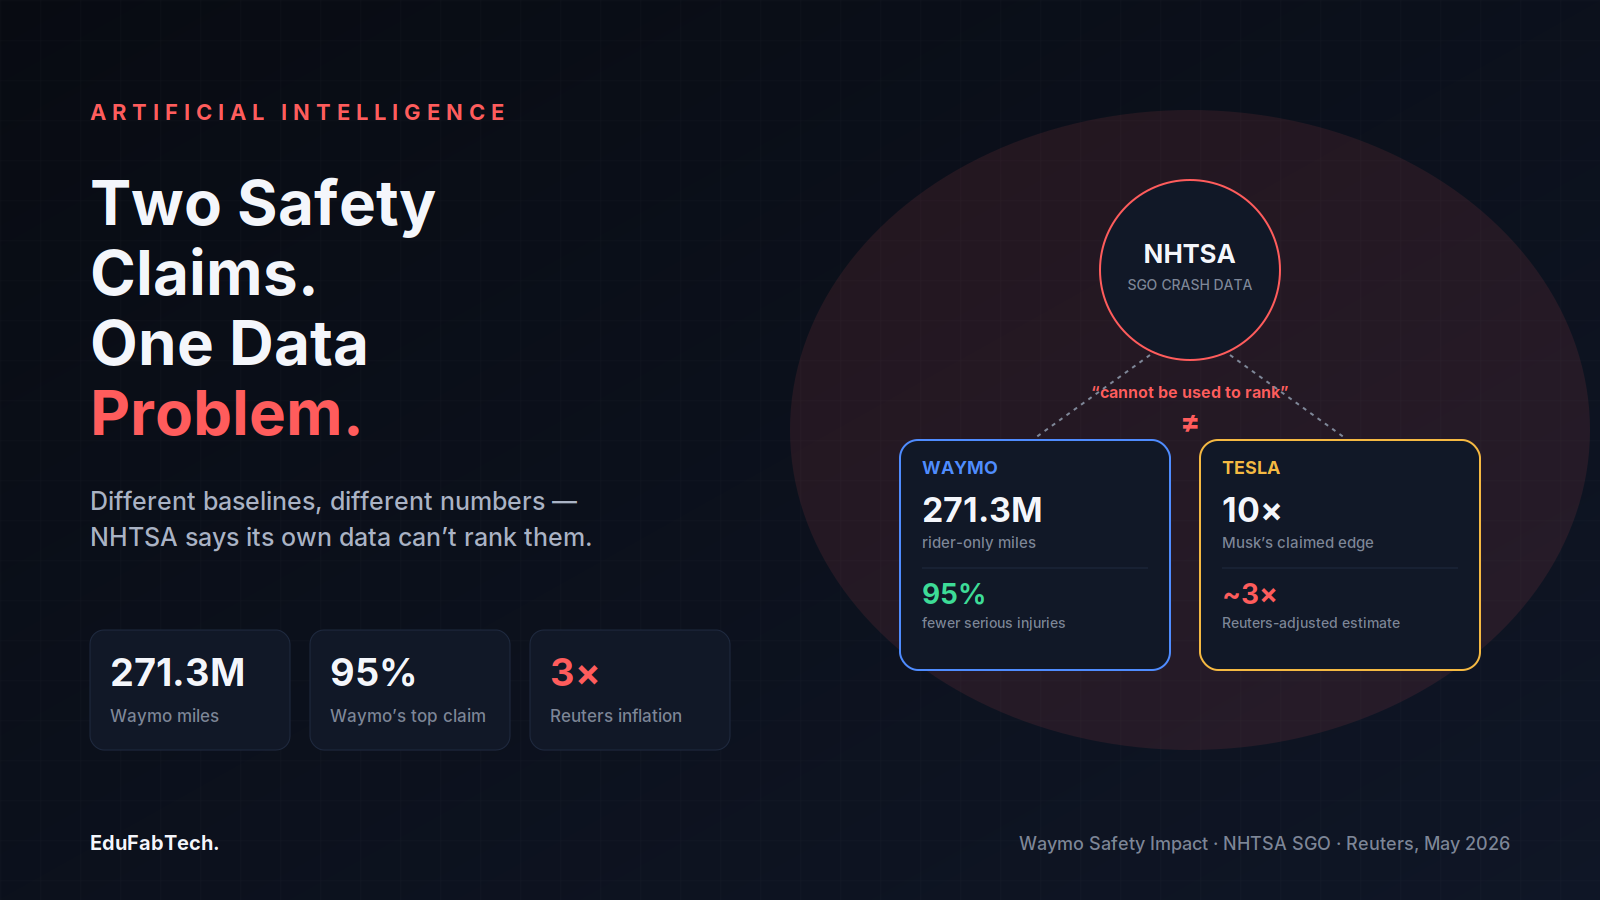
Two of the most prominent companies running automated driving systems on public roads, Waymo and Tesla, both publish numbers arguing their technology is safer than a human behind the wheel. Both numbers are large. Both are framed as settled. Neither is measuring the same thing, and the regulator whose crash database both companies feed into has said for years that the database itself should not be used to rank one company's safety against another's.
What Waymo's Safety Page Actually Measures
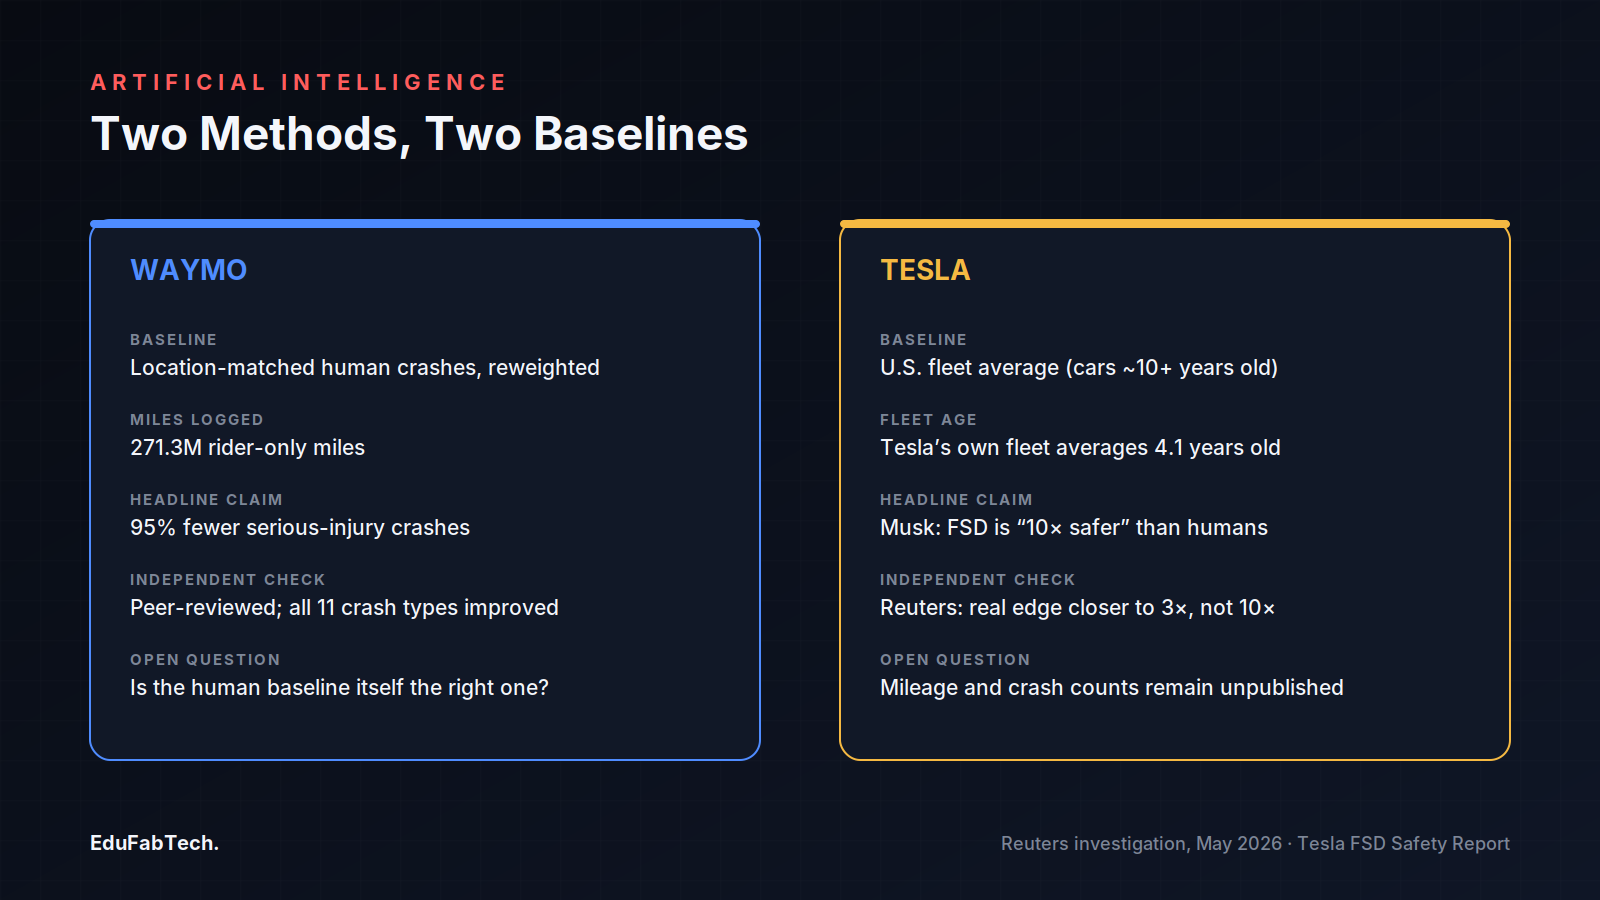
Waymo's Safety Impact page, last updated with data through June 2026, reports 271.3 million rider-only miles — meaning no human safety driver in the vehicle — across Phoenix, the San Francisco Bay Area, Los Angeles, Austin and Atlanta. Against a human-driving benchmark built from police crash reports in the same counties, Waymo claims a 95% reduction in crashes involving a serious injury or worse, an 82% reduction in crashes involving an airbag deployment, an 82% reduction in any-injury-reported crashes, a 93% reduction in pedestrian-injury crashes, an 86% reduction in cyclist-injury crashes and an 82% reduction in motorcyclist-injury crashes, all relative to that human benchmark.
The methodology behind those percentages is more careful than most vendor safety claims. Waymo uses exact Poisson confidence intervals for its crash rates and Clopper-Pearson intervals for the percent differences, and it states that intervals not crossing zero are statistically significant. It also applies what it calls a dynamic benchmark adjustment, reweighting the human comparison data to match the specific roads, cities and crash types Waymo vehicles actually drive, and it adds a 32% correction to its any-injury human baseline to account for known underreporting in police crash records. A related, peer-reviewed study by Waymo's own safety researchers, published in Traffic Injury Prevention and covering 56.7 million rider-only miles through January 2025, reported statistically significant reductions across eleven separate crash-type categories and found no category where Waymo performed worse than the human benchmark.
That last point matters, because the earlier version of this study — covering a much smaller 7.1 million miles through October 2023 — produced comparable but less statistically tight figures, roughly an 80% reduction in any-injury crashes. The confidence intervals tighten as the mileage grows, which is exactly what should happen if the underlying effect is real. The question independent researchers keep raising is not whether Waymo's math is done correctly inside its own framework, but whether the framework's baseline is the right one to compare against in the first place.
The Data Nobody Is Supposed to Use for Ranking
Both Waymo and Tesla report individual crashes to the National Highway Traffic Safety Administration under its Standing General Order on Crash Reporting, a rule covering vehicles equipped with automated driving systems or SAE Level 2 driver-assistance features. Journalists and researchers regularly pull raw counts from this dataset to compare manufacturers — reporting on the NHTSA dataset in 2025 noted Tesla had logged more than 2,300 Level 2 crash reports against 55 for GM's Super Cruise over a comparable period, a gap widely read as a safety signal.
NHTSA itself has repeatedly warned against that reading. In its 2022 release of the first Standing General Order summary data, the agency stated plainly that the figures "cannot be used to compare the safety of manufacturers against one another", because the crash counts are not normalized by the number of vehicles each manufacturer has deployed or by vehicle miles traveled — exposure data that manufacturers hold but are not required to report to NHTSA. A fleet that drives ten times as many miles will generate more crash reports than a smaller, more cautious deployment, regardless of which system is actually safer per mile. The order exists as an early-warning tool for spotting defects, not as a scoreboard.
Tesla's Changing Denominator
Tesla's own safety reporting has moved through at least two different published report formats in recent years. Through 2025 it published a quarterly Autopilot report comparing miles between crashes with Autopilot engaged to the United States fleet-wide average. In November 2025 Tesla replaced that report with a new FSD (Supervised) Vehicle Safety Report, following Waymo co-CEO Tekedra Mawakana's public call for more transparency from every company putting automated vehicles on the road, according to contemporaneous reporting. The new report claimed roughly seven times fewer major collisions and five times fewer off-highway collisions under FSD than the U.S. average, counting only crashes that triggered an airbag or other active restraint and counting FSD as "engaged" if it was active within five seconds of impact.
Carnegie Mellon University's Philip Koopman, an automated-vehicle-safety researcher who helped write the UL 4600 safety standard for autonomous systems, raised the objection that applies to any fleet-average baseline: nearly all new cars outperform the average car on the road, because that average includes vehicles over a decade old missing modern crash-avoidance features, while Tesla's own fleet averaged 4.1 years old. That objection was tested at larger scale seven months later. After Elon Musk told the public that Full Self-Driving was already "10 times safer" than human drivers — a figure well beyond anything in Tesla's own published report — Reuters published an investigation in May 2026, based on interviews with nine former Tesla data labelers, a former Autopilot engineer and eleven independent traffic-safety researchers. Reuters found the same structural problem Koopman had flagged: airbag-deployment crashes in Tesla's data measured against a federal crash category that also counts collisions serious enough only to require a tow truck, compared on a newer-than-average Tesla fleet. Correcting for it, Reuters' panel put the inflation in the claimed safety advantage at roughly a factor of three. Ten of the eleven researchers Reuters consulted said the comparison amounted to marketing rather than a rigorous safety analysis; Koopman told Reuters the exercise was "like saying: my jet airplane is faster than your World War II bomber." Tesla has not published the mileage or crash-count data that would let an outside analyst test the 10-times figure directly.
The Statistical Ceiling Underneath Both Claims
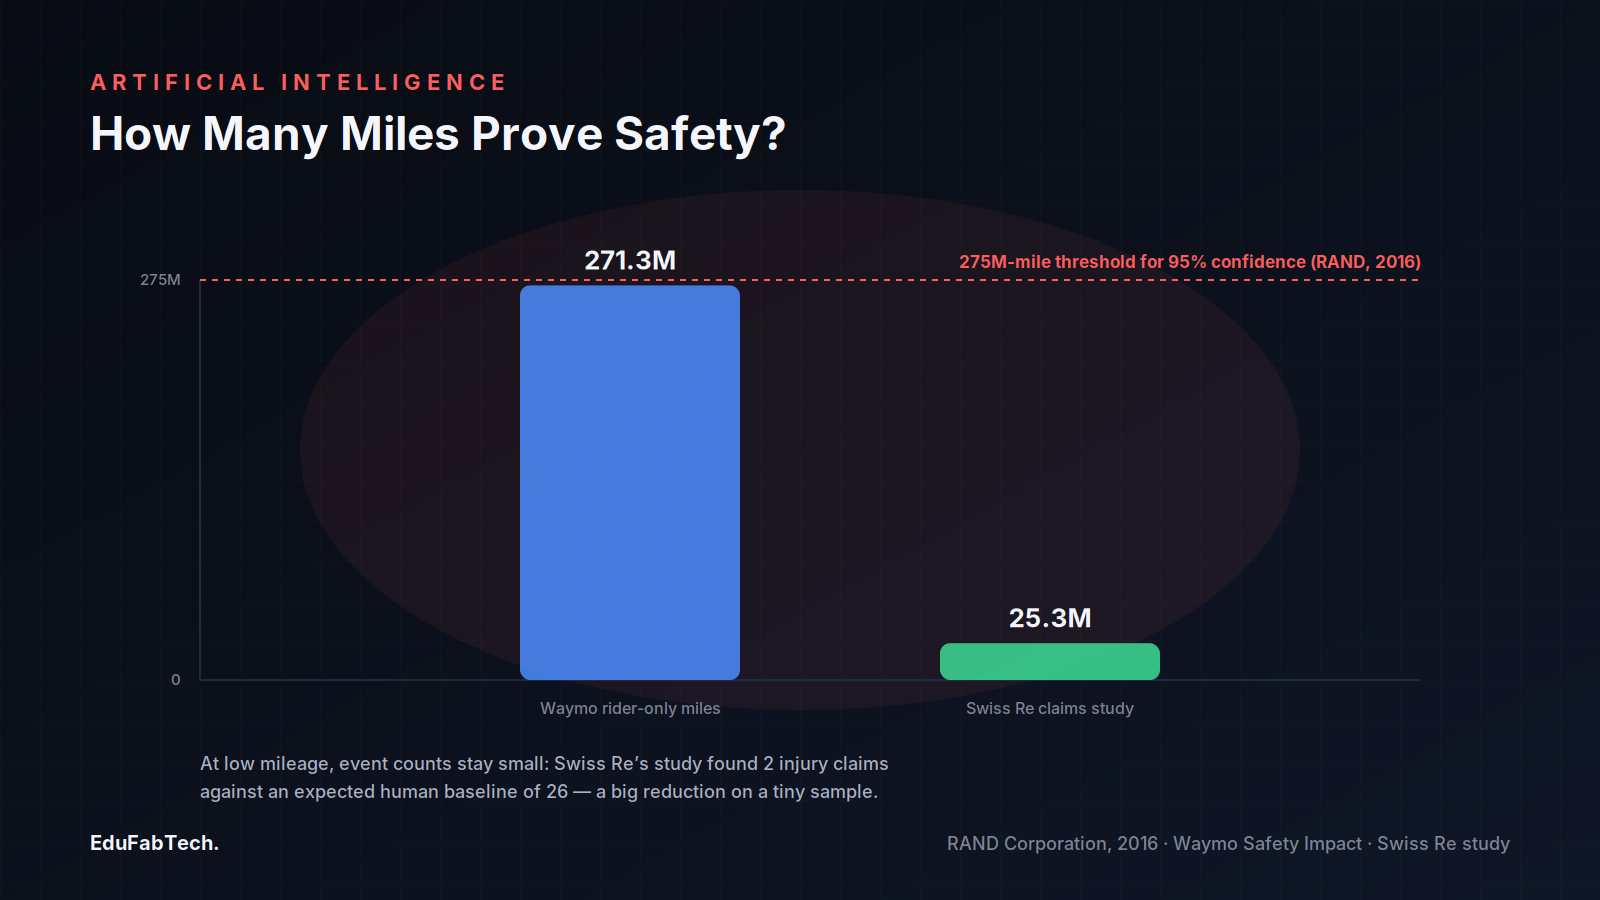
Even a methodologically clean comparison runs into a problem that predates either company's current safety report. In a 2016 RAND Corporation study, researchers Nidhi Kalra and Susan Paddock calculated how many failure-free miles an autonomous vehicle fleet would need to log to demonstrate, with 95% confidence, a fatality rate statistically indistinguishable from the human baseline of roughly 1.09 fatalities per 100 million miles. Their answer was about 275 million miles — which, driven by a 100-vehicle fleet running continuously at 25 miles per hour, would take roughly 12.5 years. For injury rates, which occur more often than fatalities but still infrequently relative to miles driven, the mileage requirement runs into the hundreds of millions to billions of miles.
That threshold is relevant to both companies' current figures. Waymo's 271.3 million-mile total is in the range RAND identified as sufficient for the most common crash types, which is part of why its wider confidence intervals on rarer events — pedestrian injuries, serious injuries — are still comparatively broad even at that scale. The underlying event counts stay small: a separate Waymo-promoted study with the reinsurer Swiss Re, covering 25.3 million fully autonomous miles, found only two bodily-injury insurance claims against an expected human-driver baseline of 26, a large relative reduction built on single-digit counts. Tesla's reported fleet, which logs vastly more total miles than Waymo's rider-only deployment, clears RAND's mileage bar more easily on raw volume, but its methodology disputes — about which baseline and which crash category to use — mean volume alone does not settle the comparison.
What Independent Researchers Keep Finding Underneath the Averages
Two more independent findings point in the same direction: that the apparent safety gap between automated and human driving is inflated by where and how automated systems are actually used, not just by how they perform.
- The Insurance Institute for Highway Safety and its Highway Loss Data Institute, in research published in July 2024, examined years of police-reported crash data across 17 U.S. states and nationwide insurance claims data for vehicles with partial automation, including Nissan's ProPILOT Assist. IIHS found that an apparent 62% reduction in front-to-rear crashes associated with ProPILOT Assist showed up equally on low-speed roads where the system provides little functional benefit, a pattern the institute attributed to a confound — who buys and where they drive these vehicles — rather than a causal safety effect. IIHS senior vice president for research Jessica Cicchino concluded that "with no clear evidence that partial automation is preventing crashes, users and regulators alike should not confuse it for a safety feature."
- Koopman's critique of the Tesla report and the Waymo methodology notes both converge on the same operating-condition issue from different directions: Tesla's FSD miles concentrate on limited-access highways, already the safest class of road, while federal baseline figures blend all road types; Waymo's deployments are geofenced to specific, mapped city zones rather than the full range of roads, weather and traffic a general human-driving population covers.
Reading the Two Companies' Numbers Side by Side
| Question | Waymo | Tesla |
|---|---|---|
| Who audited the comparison | Company safety researchers; two studies peer-reviewed in Traffic Injury Prevention | Company-published report, no peer review; the broader "10x safer" claim was examined afterward by Reuters and a panel of 11 outside researchers |
| Human baseline used | Police crash reports reweighted to Waymo's operating area, with an underreporting correction | U.S. fleet-wide average, not reweighted for vehicle age or road type |
| Independent recalculation available | Not published independently, but underlying mileage and crash counts are disclosed | No independent recalculation of Tesla's own report has been published; for the related "10x safer" claim, Reuters' panel put the comparable methodology's inflation at roughly 3x, and Tesla has not released data to test the figure directly |
| What the regulator says | NHTSA's Standing General Order data is not designed to rank manufacturers against each other | Same caveat applies |
What Can Actually Be Said With Confidence
None of this means automated driving systems are unsafe, and none of it means the published reductions are fabricated. Waymo's peer-reviewed studies describe a real methodology with disclosed mileage, disclosed crash counts and calculated confidence intervals, which is more than most companies publish about any safety claim. What the independent record supports is narrower: that neither company's headline percentage is directly comparable to the other's, that NHTSA's own crash-reporting system was not built to adjudicate between them, and that every comparison published so far — by the companies or by their critics — still has to correct for where, on what roads, and under what conditions the automated miles were actually driven before the reduction in crashes can be attributed to the driving system itself rather than to the easier job it was given.
For readers trying to evaluate a specific number, the practical checklist drawn from this record is short: ask what counts as the denominator (engaged miles, total miles, or rider-only miles), ask whether the human baseline was adjusted to match the same roads and vehicle ages, ask whether the underlying event counts are large enough to support the percentage being quoted, and ask who performed the comparison. Those four questions, applied consistently, explain most of the gap between what Waymo and Tesla say about their own systems and what NHTSA, RAND, IIHS and independent researchers say can actually be concluded from the public data.
A quick question for readers
Which skill will matter most for getting a job in 2030?
Everyone has a prediction. Add yours and see what students are betting on.
Pick an answer, create a free account in a minute, and your vote counts. Already a member? Sign in
Comments 0
CommentNo comments yet. Members start the conversation.
Source: Waymo LLC
Sources (5)
- Waymo LLC. Waymo Safety Impact. Waymo Safety Hub, 2026. waymo.com ↗ · checked 14 Oct 2026
- National Highway Traffic Safety Administration. NHTSA Releases Initial Data on Safety Performance of Advanced Vehicle Technologies. NHTSA, 2022. nhtsa.gov ↗ · checked 14 Oct 2026
- Nidhi Kalra, Susan M. Paddock. Driving to Safety: How Many Miles of Driving Would It Take to Demonstrate Autonomous Vehicle Reliability?. RAND Corporation, 2016. rand.org ↗ · checked 14 Oct 2026
- Insurance Institute for Highway Safety / Highway Loss Data Institute. IIHS-HLDI Research Finds Little Evidence That Partial Automation Prevents Crashes. IIHS, 2024. iihs.org ↗ · checked 14 Oct 2026
- Chris Kirkham, Rachael Levy. Tesla's Former AI Trainers Don't Trust Its Self-Driving Tech or Safety Stats. Reuters (text as syndicated via Carrier Management), 2026. carriermanagement.com ↗ · checked 14 Oct 2026