A GPT-5 Checker Flagged Errors in 99.2% of 2,500 AI Papers — Read the Fine Print
A GPT-5-based tool found objective mistakes in NeurIPS, ICLR and TMLR papers with 83.2% precision, but its 60% recall came from only 90 errors the authors planted themselves — and a separate benchmark suggests real-world detection is much harder.
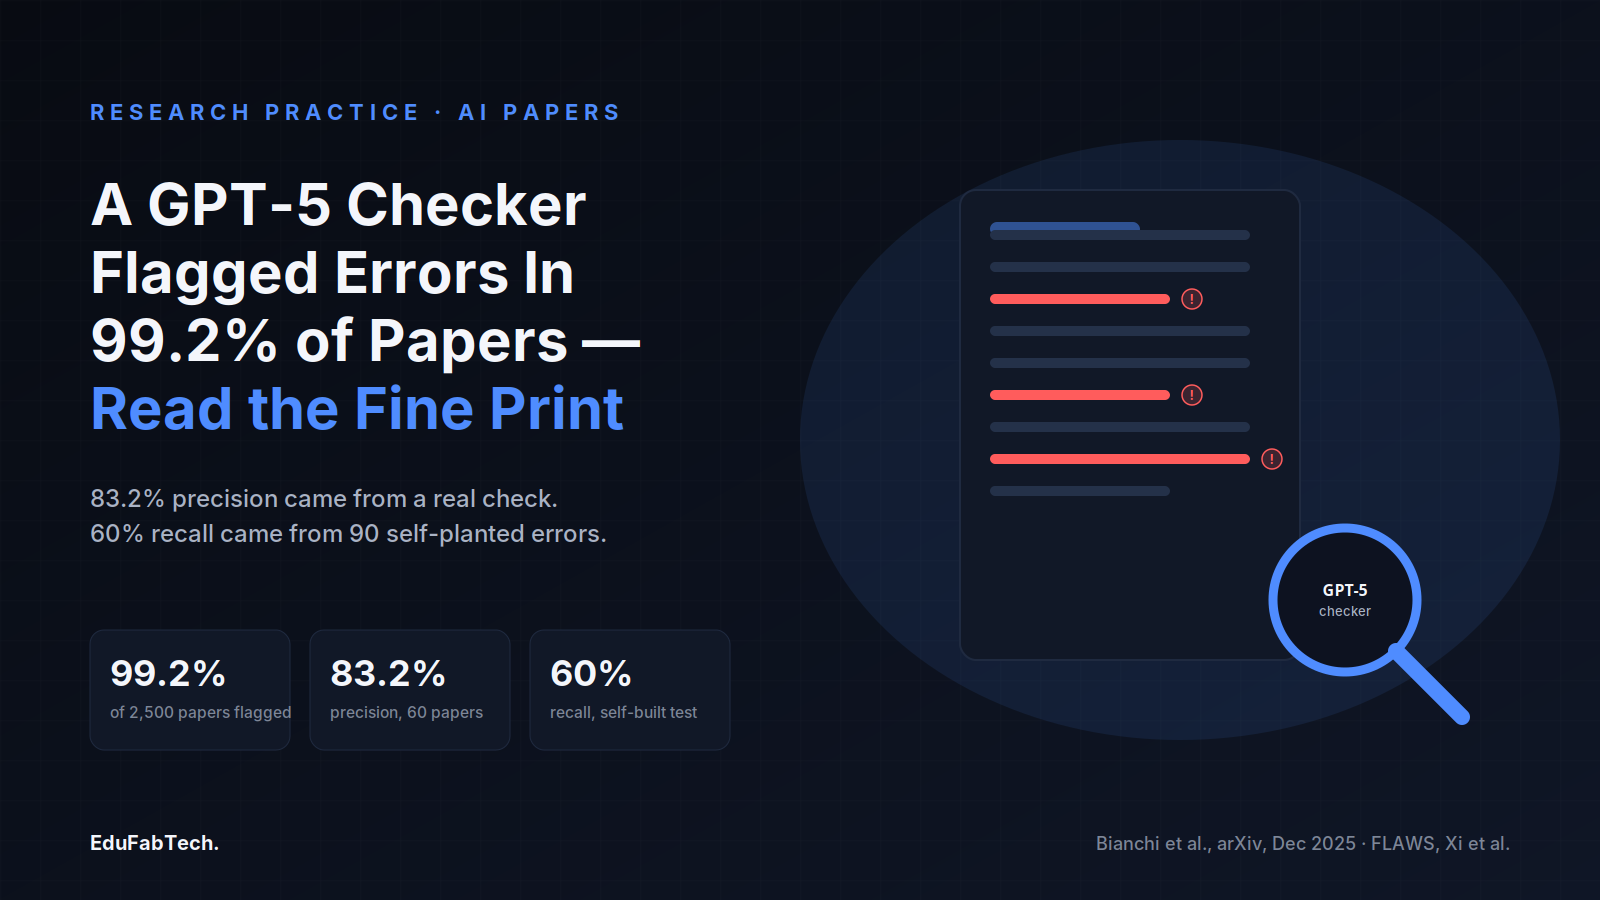
A paper posted to arXiv in December 2025 makes a claim that is easy to misread as a verdict on the honesty of an entire field: a GPT-5-based checker found at least one objective mistake in 99.2% of 2,500 papers sampled from NeurIPS, ICLR and TMLR. Read past the headline number, though, and the paper is something more useful — a case study in how to judge a correctness-checking tool's own numbers before trusting what it tells you about everyone else's work.
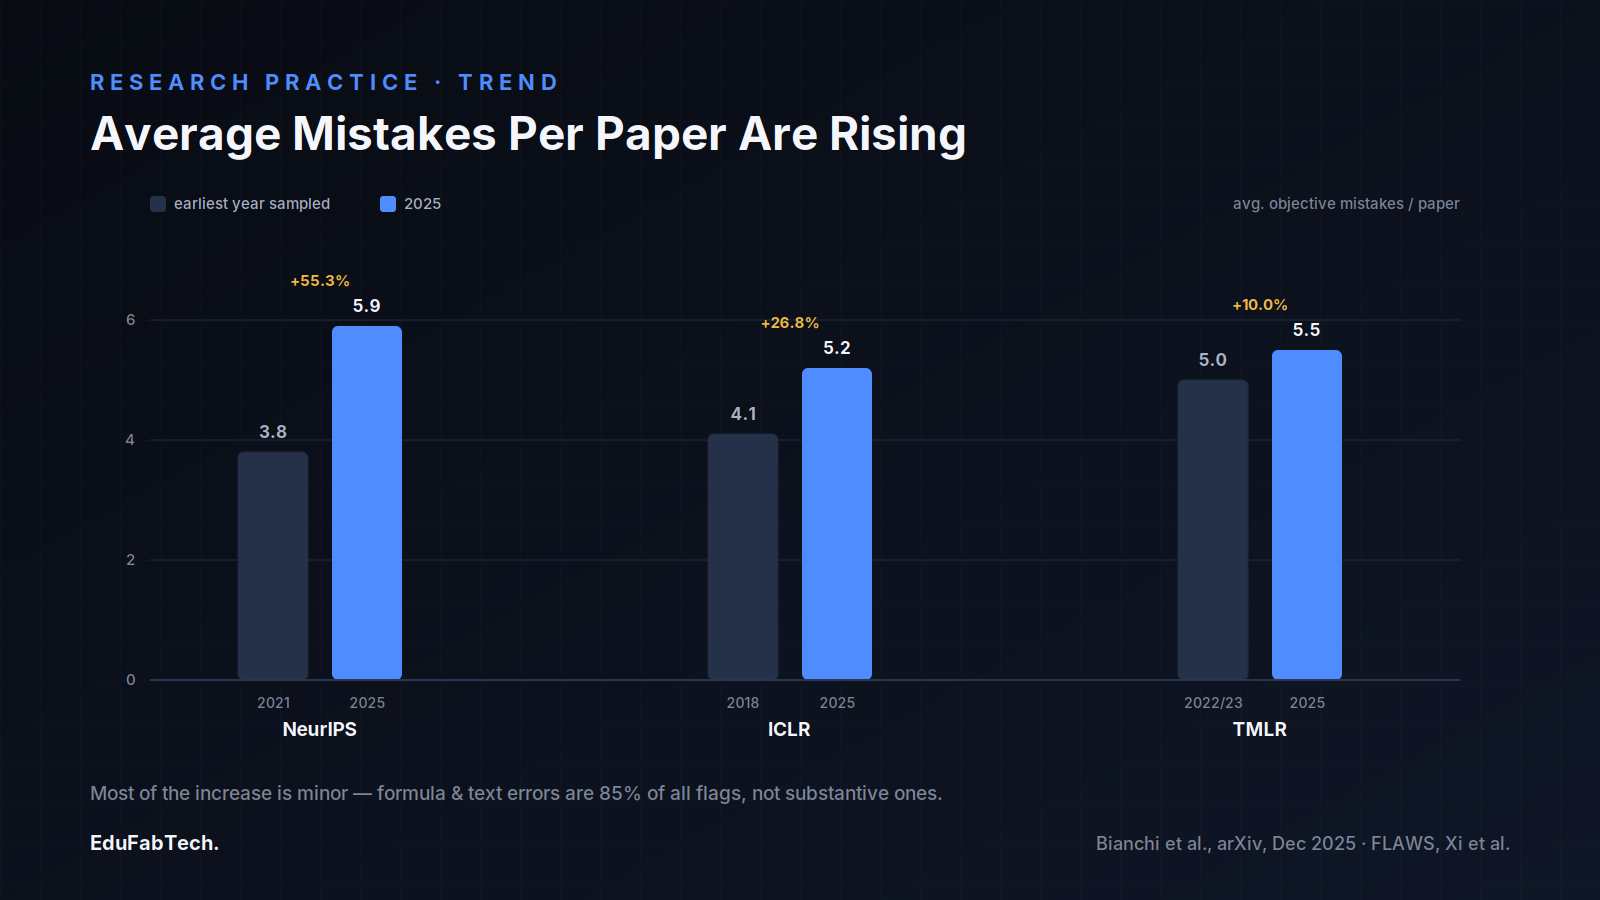
The study, "To Err Is Human: Systematic Quantification of Errors in Published AI Papers via LLM Analysis", is by Federico Bianchi, Yongchan Kwon, Zachary Izzo, Linjun Zhang and James Zou. It reports an average of 4.66 flagged mistakes per paper across the 2,500-paper sample (1,600 from ICLR, 500 from NeurIPS and 400 from TMLR), and finds the average rising at each venue: from 3.8 mistakes per paper at NeurIPS 2021 to 5.9 at NeurIPS 2025, a 55.3% increase; from 4.1 at ICLR 2018 to 5.2 at ICLR 2025; and from 5.0 at TMLR in 2022/23 to 5.5 at TMLR 2025, according to the paper.
Before any of that is useful to a reader, two questions need answers: what does the checker count as a "mistake," and how do we know it is right? The paper answers the first question directly. The checker targets objective mistakes — errors in formulas, derivations, calculations, figures and tables — that have a clearly verifiable ground truth, rather than judgment calls about novelty, significance or framing. Within that category, the authors split mistakes into "potentially substantive" ones, which could change some of a paper's results, alter the interpretation of its findings, or cause non-obvious confusion for a typical reader, and minor ones, such as wrong cross-references, inconsistent notation or formula typos that don't touch the main results.
That distinction matters for how alarming the top-line numbers actually are. Most of the 4.66 average mistakes per paper fall in the minor bucket. The paper reports that potentially substantive mistakes appear in 23.8% of ICLR papers, 30.8% of NeurIPS papers and 36.0% of TMLR papers in the sample — a meaningfully smaller, though still not small, slice of the literature than "99.2% of papers have an error" suggests on its own.
What the checker actually flags
The paper breaks its flagged mistakes down by type: math and formula errors made up 54.0% of everything found, followed by text errors at 31.4%, table and figure errors at 9.3%, and cross-reference errors at 5.3%. Among the specific cases the authors describe, one ICLR 2018 paper on word embeddings is reported to have overstated the size of a training dataset by roughly a hundredfold — citing 30 million pairs where the dataset in question contains closer to 300,000.
That kind of error is exactly what a careful reader, or a diligent reviewer with time to check every number against its source, could in principle catch. The question the paper is really testing is whether an LLM-based checker can do that checking at a scale no reviewer has time for — and whether its own accuracy claims hold up.
Checking the checker
The authors validated their tool in two separate ways, and the two give very different kinds of confidence. For precision, human experts reviewed 316 mistakes the checker flagged across 60 published papers and confirmed 263 of them as genuine, for a precision of 83.2%. That is a reasonably large, real-world validation sample, and it is the number most likely to get quoted on its own.
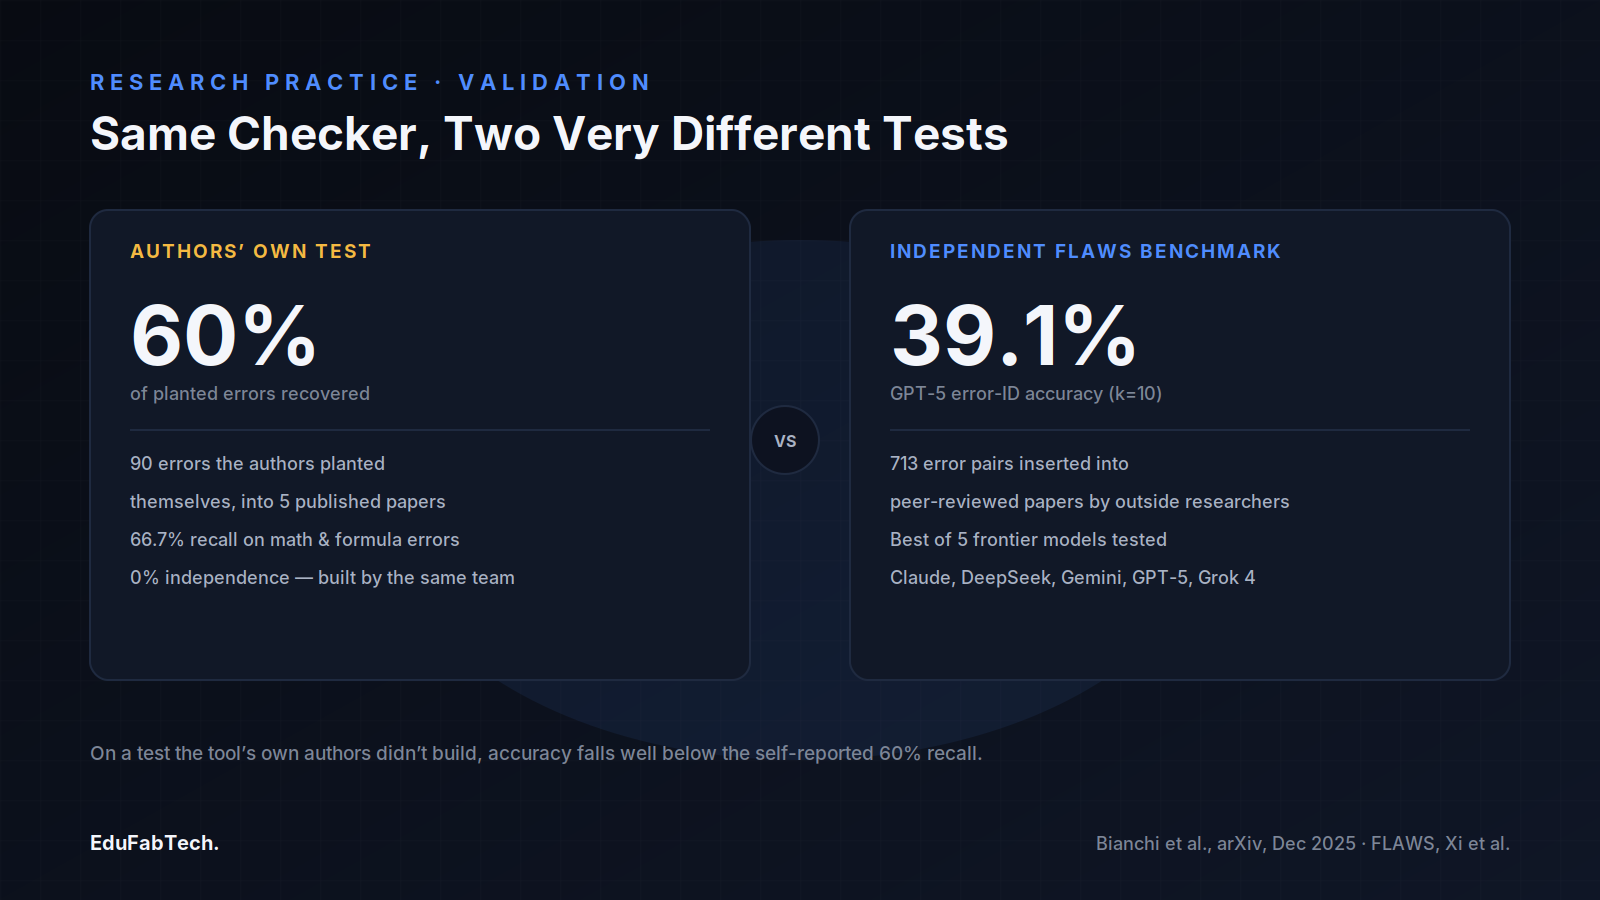
For recall — whether the checker catches most of the mistakes that are actually there, not just whether its flags are correct — the test set is far smaller and was built by the authors themselves. They created 90 injected mistakes by deliberately planting six errors apiece into 15 mistake-injected versions of five published papers, across the same four error categories, then ran the checker against them three times. It recovered 60.0% of the planted errors overall, with better detection of math and formula errors (66.7%) than of other categories. The authors note this means the raw count of mistakes the checker reports across the full 2,500-paper sample should be read as a conservative lower estimate, not a ceiling.
A recall figure built from 90 errors that the same team wrote into five papers is a legitimate first check, but it is not an adversarial one: the authors know what their own injected errors look like, and the checker was built by people who understand the kinds of mistakes GPT-5 tends to miss. A reader deciding how much weight to put on "60% recall" should notice that the number describes performance on a test the tool's own authors designed, not on an independent benchmark built by people with no stake in the result.
A harder, independent test points lower
That gap is visible in a separate benchmark released around the same period. FLAWS: A Benchmark for Error Identification and Localization in Scientific Papers, by Sarina Xi, Vishisht Rao, Justin Payan and Nihar B. Shah, builds a dataset of 713 paper-error pairs by systematically inserting errors that undermine key claims into peer-reviewed papers, then scores how well frontier models can find and localize them. Testing five models — Claude Sonnet 4.5, DeepSeek Reasoner V3.1, Gemini 2.5 Pro, GPT-5 and Grok 4 — the authors report that GPT-5 performed best, with 39.1% identification accuracy when allowed ten ranked guesses per paper (k=10).
The two studies are not measuring identical things — FLAWS scores identification and localization of claim-undermining errors specifically, while the "To Err Is Human" recall figure covers a broader mix of formula, text, table and cross-reference mistakes. But the comparison is still instructive: on a dataset the model's own team didn't construct, the best-performing frontier model's accuracy at finding inserted errors is well below the 60% recall reported for the self-built 90-error test. Neither number is wrong on its own terms; they simply answer different, narrower questions than "can an AI tell you whether a paper is right."
This is not a new argument, just a newly automated one
Automated consistency-checking of published statistics predates large language models by a decade. Nuijten, Hartgerink, van Assen, Epskamp and Wicherts, writing in Behavior Research Methods in 2016, ran the statcheck algorithm — which recomputes a p-value from its reported test statistic and degrees of freedom and compares it with what the authors printed — across more than 250,000 p-values in eight major psychology journals from 1985 to 2013. They found that half of all papers using null-hypothesis significance testing contained at least one inconsistent p-value, and one in eight contained a grossly inconsistent one that could have affected the paper's statistical conclusion.
An even simpler, fully manual precursor is the GRIM test, introduced by Nicholas Brown and James Heathers in Social Psychological and Personality Science in 2017. GRIM checks whether a reported mean of integer data — a Likert-scale score, say — is even arithmetically possible given the stated sample size and number of items. Testing 71 papers where the technique applied, they found about half (36) contained at least one inconsistent mean, and more than a fifth (16) contained multiple inconsistencies; when they requested the underlying datasets for 21 of the flagged articles, nine research teams responded, and all nine confirmed at least one genuine reporting error, three of which required extensive correction.
How to read a correctness-checking claim
None of this means automated checkers are useless, or that the rising error counts in "To Err Is Human" are wrong. It means the number that matters most in any such study is rarely the headline prevalence rate. It is the validation methodology behind it. Before taking a tool's error-detection claim at face value, a few questions are worth asking:
- Who built the test set used to measure recall, and did they also build the tool? A self-constructed set of 90 injected errors answers a narrower question than an adversarial, independently built benchmark.
- Does the precision number come from a large enough human-reviewed sample to be stable — in this case, 316 flagged items across 60 papers — or from a handful of spot checks?
- Is the prevalence figure dominated by minor issues (typos, cross-references) or by the substantive share the authors themselves separate out?
- Does an independent benchmark exist for the same general task, and if so, does it produce a similar number?
Applied to "To Err Is Human," those questions don't overturn the finding that error counts are real and appear to be rising at NeurIPS, ICLR and TMLR. They do mean the 60% recall figure, and by extension the "conservative lower estimate" framing the authors themselves use, should be read as a first approximation rather than a settled rate — and that the FLAWS benchmark's lower, independently measured accuracy is the more cautious number to keep in mind when a tool like this is pointed at a paper that matters to you.
A quick question for readers
Which study habit do you think is most overrated?
Some popular habits have little evidence behind them. Which one do you think gets too much credit?
Pick an answer, create a free account in a minute, and your vote counts. Already a member? Sign in
Comments 3
Comment-
The 90-error test set is the tell for me. Same team that built the checker also planted the errors it was graded on, got 60% back, and then…
-
The part that undercuts the headline isn't the 99.2% or even the 60% recall — it's that the 60% comes from a 90-error set the authors plante…
-
The number I'd actually put on a slide isn't 99.2%, it's 90. That recall figure comes from the authors injecting six errors each into fiftee…
Join free to read the full comments and reply Comments are between members; an account takes a minute.
Source: arXiv
Sources (4)
- Federico Bianchi, Yongchan Kwon, Zachary Izzo, Linjun Zhang, James Zou. To Err Is Human: Systematic Quantification of Errors in Published AI Papers via LLM Analysis. arXiv, 2025. arxiv.org ↗ · checked 13 Nov 2026
- Sarina Xi, Vishisht Rao, Justin Payan, Nihar B. Shah. FLAWS: A Benchmark for Error Identification and Localization in Scientific Papers. arXiv, 2025. arxiv.org ↗ · checked 13 Nov 2026
- Michèle B. Nuijten, Chris H. J. Hartgerink, Marcel A. L. M. van Assen, Sacha Epskamp, Jelte M. Wicherts. The prevalence of statistical reporting errors in psychology (1985–2013). Behavior Research Methods, 2016. doi.org ↗ · checked 13 Nov 2026
- Nicholas J. L. Brown, James A. J. Heathers. The GRIM Test: A Simple Technique Detects Numerous Anomalies in the Reporting of Results in Psychology. Social Psychological and Personality Science, 2017. journals.sagepub.com ↗ · checked 13 Nov 2026