New Multiverse Plots Show 98.7% of Hurricane-Name Specifications Agree in Sign, 2.1% Hit Significance at 5%
A February 2026 PLOS One paper introduces a new chart for multiverse analysis and uses it to re-examine a widely cited 2014 hurricane-names study, showing how checking only an effect's direction can hide how fragile a finding is.
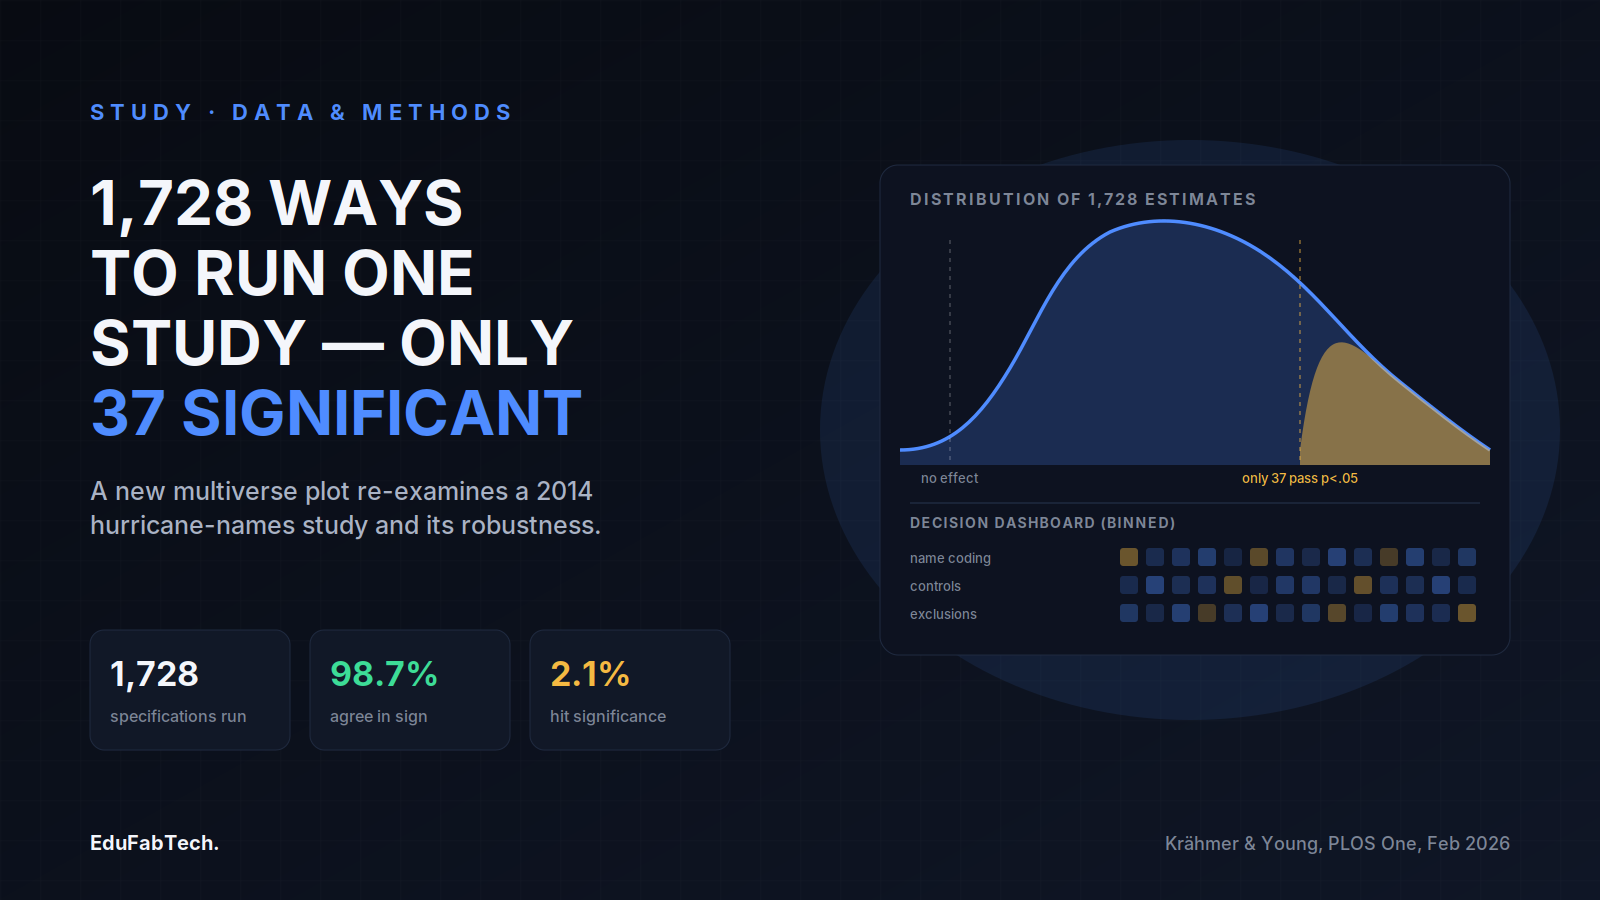
Most papers report one analysis. A multiverse analysis reports hundreds or thousands of them at once, running every reasonable combination of the decisions a researcher could have made — which cases to exclude, which covariates to include, which model to fit — and showing the reader the full spread of results rather than the single estimate that happened to clear a significance threshold. The idea has existed for years, but the charts used to display it have struggled to keep up with how large these analyses have become.
A paper by Daniel Krähmer of the University of Munich and Cristobal Young of Cornell University, published in PLOS One in February 2026, sets out why the two standard charts for multiverse analysis break down once a study runs into the thousands of specifications, and proposes a replacement they call the multiverse plot. To make the case concrete, they rerun a well-known study and show what their chart reveals that the older ones did not.
The paper opens by stating the problem plainly: "Multiverse analysis is an increasingly popular tool for improving the robustness and transparency of empirical research. Yet, visualization techniques for multiverse analysis are underdeveloped." That gap matters for anyone trying to judge whether a published result would have held up under a different, equally defensible set of analytic choices.
What counts as one analysis in a multiverse
A single specification is one path through a researcher's decision tree: a choice of control variables, a choice of which outliers to drop, a choice of functional form, and so on. Multiply the number of options at each decision point together and the number of possible specifications grows fast — a handful of binary choices can already produce hundreds of distinct analyses of the same dataset, each one defensible on its own terms.
The method for summarizing all of those analyses at once is widely known as specification curve analysis, formalized by Uri Simonsohn, Joseph Simmons and Leif Nelson in a 2020 paper in Nature Human Behaviour. Their approach ranks every specification's estimate from lowest to highest and plots it as a curve, with a panel underneath — often called a decision dashboard — indicating which analytic choice was active in each specification. It gave researchers a way to show, rather than just claim, that a result does not depend on one arbitrary decision among many defensible ones.
Where the old charts break down
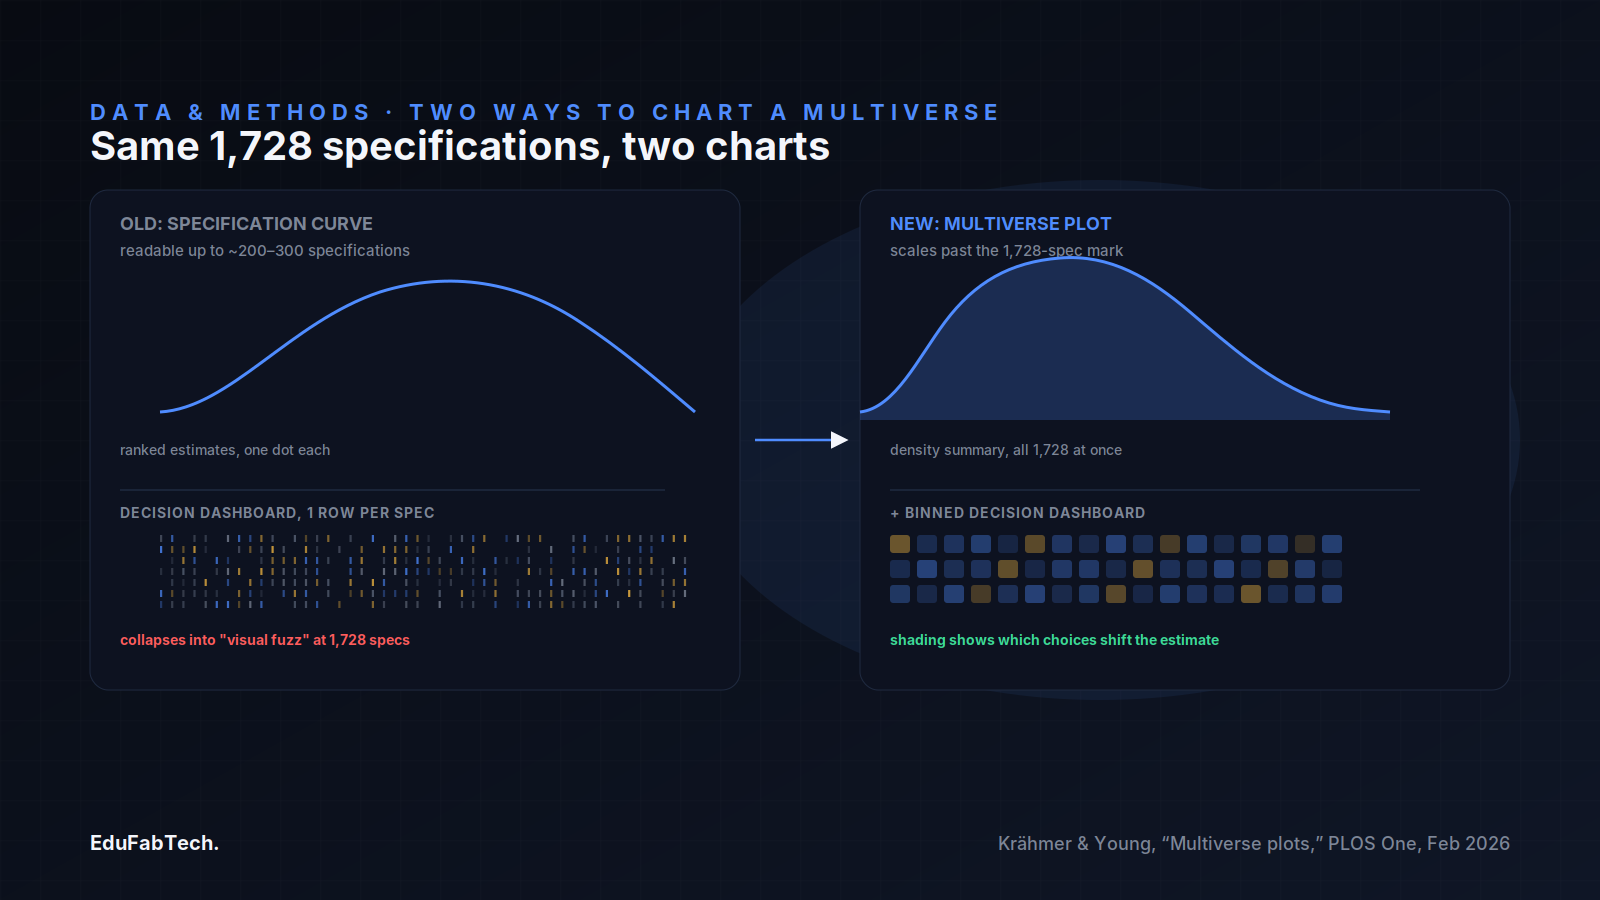
Krähmer and Young's complaint is not with the logic of specification curves but with what happens when the number of specifications grows into the thousands. As they put it, specification curves "typically max out at around 200 to 300 estimates before the decision dashboard collapses into visual 'fuzz.'" Beyond that point, the rows of ticks and dots that are supposed to tell a reader which decision drove which estimate become too dense to read, and authors often resort to sampling a subset of specifications to keep the chart legible — a step that introduces its own distortions, since random sampling risks dropping the most extreme results and selective sampling skews the picture in other ways.
The alternative that scales better is a density plot, which simply shows the distribution of all the estimates as a smooth curve or histogram. It can handle any number of specifications without becoming unreadable. But Krähmer and Young point out that it buys that scalability at a cost. Density plots, they write, "do not address a central question: which modeling decisions drive variation in estimates?" — because, unlike specification curves, they have "not been paired with a decision dashboard, leaving analysts with no visual representation of how specific analytical choices shape the distribution." A density plot can tell you that results vary a lot, but not why, or which choice a skeptical reader should interrogate first.
The hurricane study used as the test case
To demonstrate their alternative, the authors reanalyze a paper that has circulated in psychology and popular science writing for over a decade: a 2014 study in the Proceedings of the National Academy of Sciences by Kiju Jung, Sharon Shavitt, Madhu Viswanathan and Joseph Hilbe, titled "Female hurricanes are deadlier than male hurricanes." As Krähmer and Young describe it, the study "claimed to have documented" a pattern they term "implicit sexism" — the idea that hurricanes given feminine names caused more deaths than those given masculine names, because people took the storms less seriously. Running the possible alternative specifications of that analysis — different ways of coding storm names, different sets of control variables, different exclusion rules for which storms to count — Krähmer and Young generate what they describe as "a multiverse of 1,728 unique specifications."
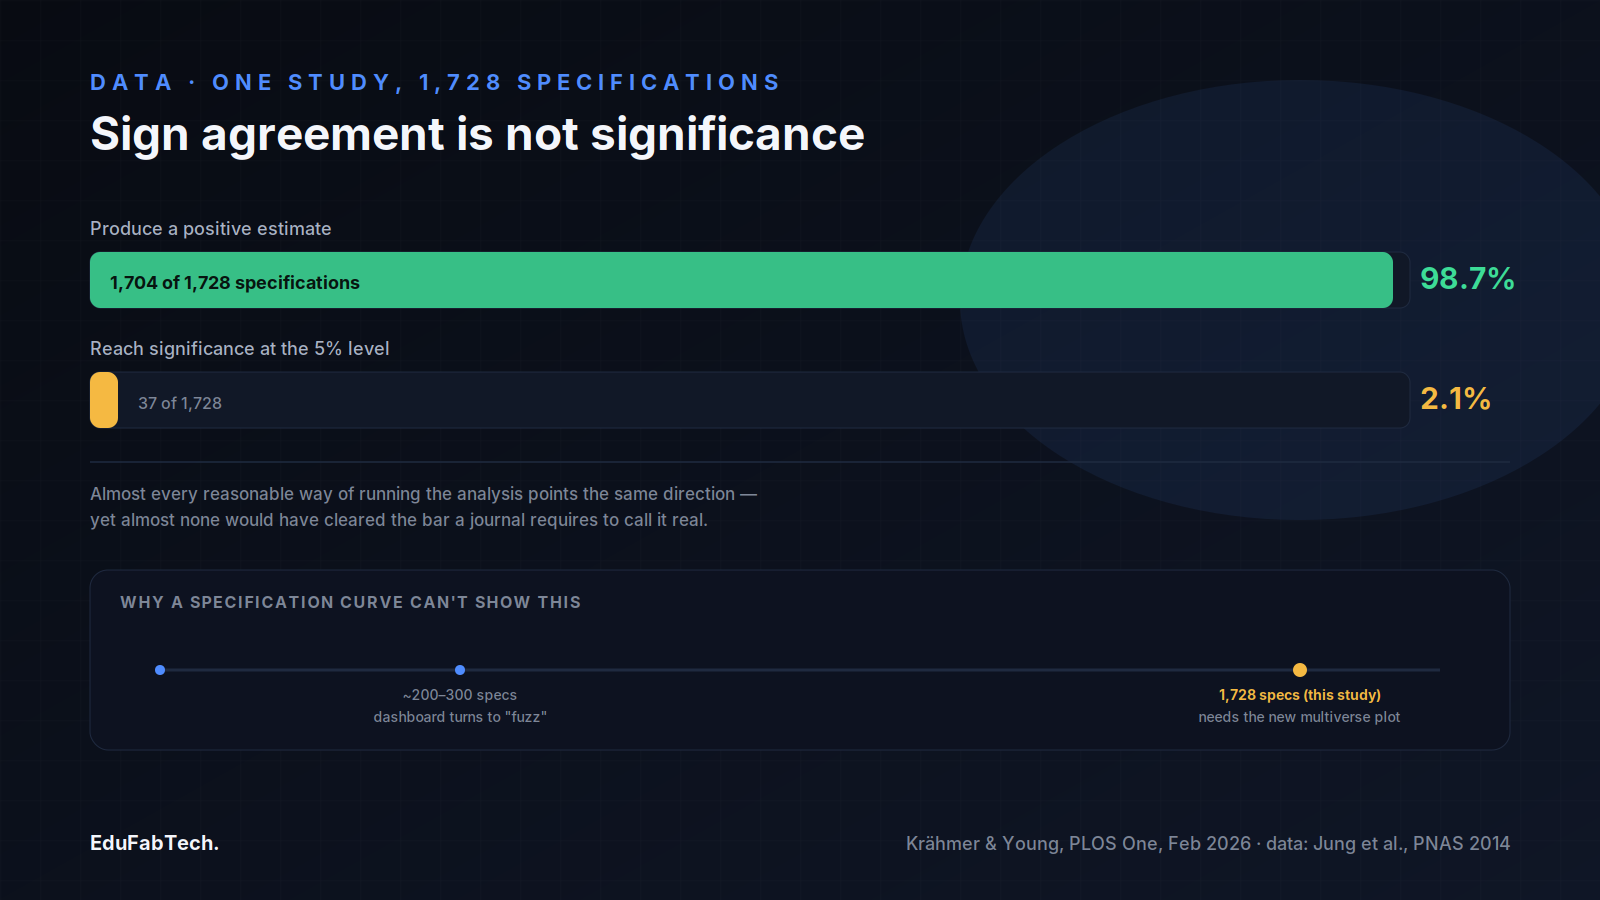
The result is the clearest illustration of why the two numbers a multiverse analysis reports — the direction of an effect and its statistical significance — can tell very different stories. "Of the 1,728 model specifications," the paper reports, "1,704 (98.7%) produce positive estimates, but only 37 (2.1%) reach significance at the 5% level." Almost every reasonable way of running the analysis points the same direction, yet almost none of those versions would have cleared the bar a journal typically requires to call a result real. A reader looking only at the sign of the effect would conclude the finding is remarkably consistent; a reader looking only at significance would conclude it is almost never there.
How to read the new chart
The multiverse plot Krähmer and Young propose is built to hold both of those facts on the same page. It pairs a density-based summary of the full distribution of estimates, shown in an upper panel, with a binned decision dashboard underneath, so the dashboard retains the same diagnostic function as a specification curve's but is now grouped into bins rather than drawn as one dot per specification. As the authors put it, "multiverse plots preserve the interpretive power of specification curves by retaining a decision dashboard, but avoid the combinatorial overload by pairing it with a density-based summary of the full modeling distribution." Shading intensity in the dashboard, together with coefficients from a meta-regression of the specification choices on the resulting estimates, is used to show which decisions are associated with bigger or smaller effects, rather than leaving a reader to guess from a wall of ticks.
For a reader without the software to redraw the chart themselves, the usefulness of this format is in what it forces into view at once: the overall spread of results, and which modeling choices are pulling that spread in which direction. A paper that reports a single robustness table, chosen by the authors themselves, is not offering the same thing — it is offering a curated sample of the multiverse, not the multiverse.
What this means when reading someone else's robustness claims
The hurricane case is a useful stress test precisely because it is not a case of outright fabrication or an obviously broken dataset. Every one of the 1,728 specifications is a plausible way to run that analysis, and nearly all of them point the same direction. What splits once you add significance testing is whether the data are strong enough to rule out chance for any single one of those plausible choices. That split — high agreement in sign, low agreement in significance — is exactly the pattern a reader should learn to look for before accepting a claim of robustness at face value.
A few questions follow directly from the paper's own framing:
- Did the authors run a defined space of alternative specifications, or a small, self-selected set of "robustness checks" chosen after they already knew the headline result?
- If a specification curve or multiverse plot is shown, how many specifications does it cover, and does the chart show signs of being thinned out to stay legible — Krähmer and Young's "visual fuzz" threshold of roughly 200 to 300 estimates is a reasonable rule of thumb for when to ask that question?
- Does the paper report both the direction and the significance of effects across specifications, or only one of the two?
- Where a decision dashboard is shown, which specific choices (sample restrictions, control variables, model family) are associated with the largest swings in the estimate, and are those the choices the original authors made?
- Is the underlying code available, as Krähmer and Young provide for their own method in both Stata and R, so that a reader could in principle rerun the multiverse rather than take the chart on trust?
None of this requires a reader to rerun 1,728 regressions personally. It requires noticing whether a paper's robustness claim rests on a handful of chosen checks or on a mapped-out space of alternatives, and whether the chart used to summarize that space is built to show where a result is solid and where it is not — which is the gap the PLOS One paper is addressing directly.
A quick question for readers
Which study habit do you think is most overrated?
Some popular habits have little evidence behind them. Which one do you think gets too much credit?
Pick an answer, create a free account in a minute, and your vote counts. Already a member? Sign in
Comments 3
Comment-
The 2.1% figure is the one worth sitting with, not the 98.7%. Everyone in the thread seems happy that direction holds up almost everywhere,…
-
The part worth sitting with is that 98.7% sign-agreement and 2.1% significance are describing the exact same 1,728 specifications. Nobody fa…
-
The split between 98.7% and 2.1% is the whole story here. If I only saw the sign agreement I'd tell a student the hurricane-names effect is…
Join free to read the full comments and reply Comments are between members; an account takes a minute.
Source: PLOS One
Sources (3)
- Daniel Krähmer, Cristobal Young. Visualizing vastness: Graphical methods for multiverse analysis. PLOS One, 2026. journals.plos.org ↗ · checked 20 Nov 2026
- Uri Simonsohn, Joseph P. Simmons, Leif D. Nelson. Specification curve analysis. Nature Human Behaviour, 2020. nature.com ↗ · checked 20 Nov 2026
- Kiju Jung, Sharon Shavitt, Madhu Viswanathan, Joseph M. Hilbe. Female hurricanes are deadlier than male hurricanes. Proceedings of the National Academy of Sciences, 2014. doi.org ↗ · checked 20 Nov 2026