Same Data, Different Answers: What 504 Independent Re-Analyses of 100 Studies Reveal About Reading a Single Paper
A 2026 Nature study gave 457 analysts the same datasets and the same questions; how they diverge shows why one result, on its own, rarely settles anything.
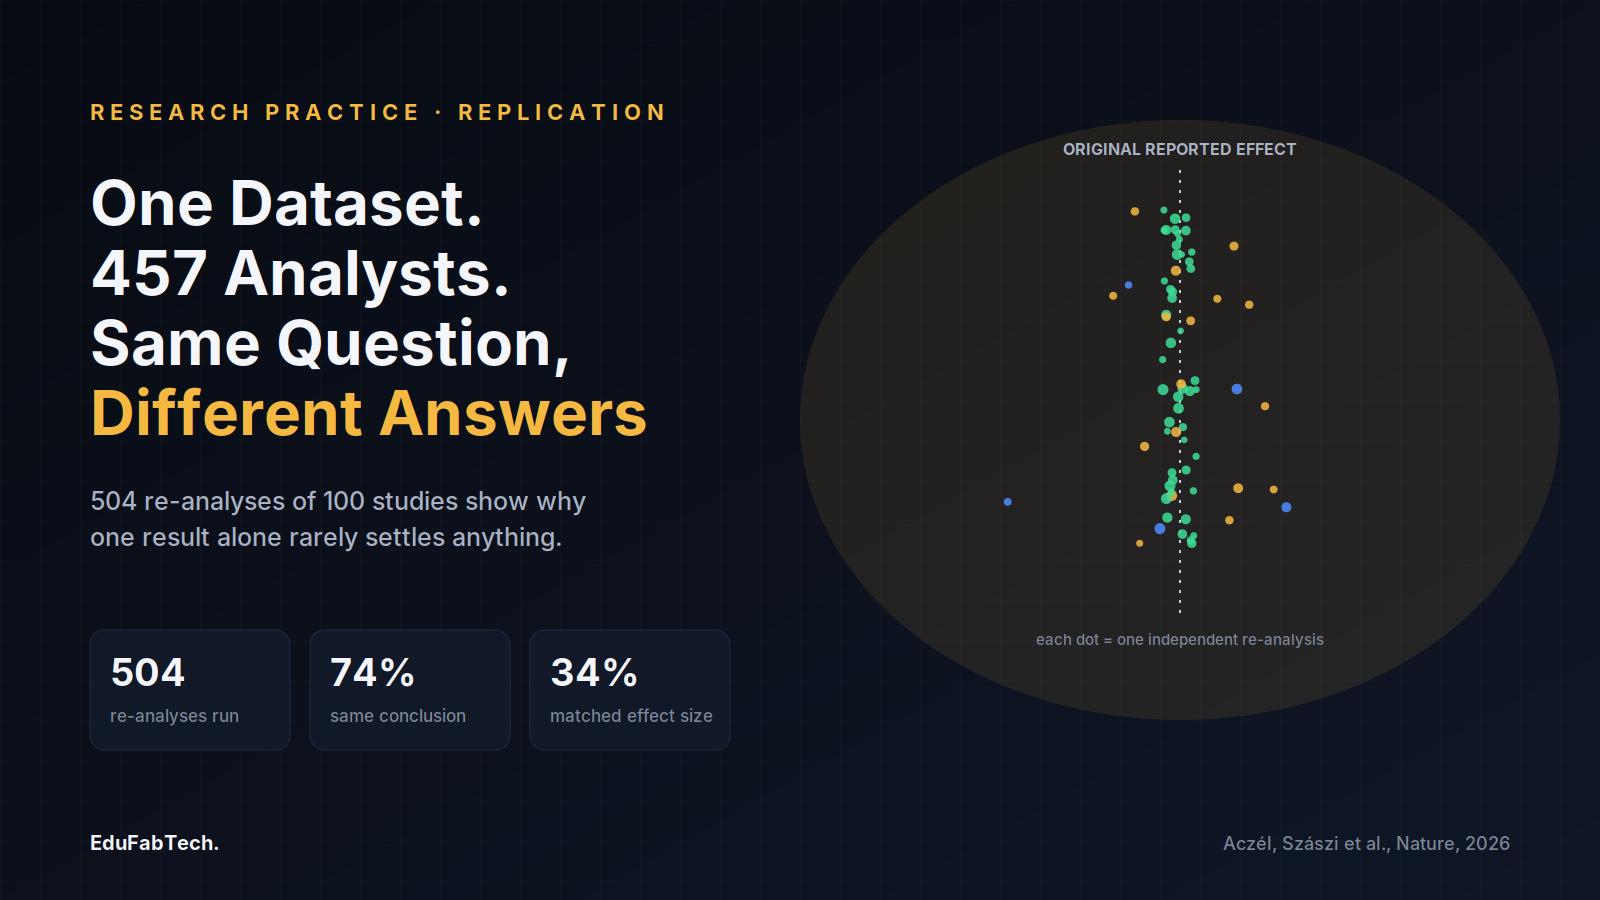
Give one dataset and one research question to hundreds of competent, independent analysts, and how often do they land on the same answer? A collaboration led by Balázs Aczél and Barnabás Szászi, published in Nature in 2026, ran that experiment at a scale no one had attempted before: 457 analysts, 504 separate re-analyses, 100 previously published social and behavioral science studies, each reanalyzed by at least five people working from the original data and the original research question. The project, known as Multi100, was not testing whether the original authors had made mistakes. It was testing something quieter and, for anyone who reads research for a living, more unsettling: whether defensible, honest analytical choices alone are enough to move a conclusion.
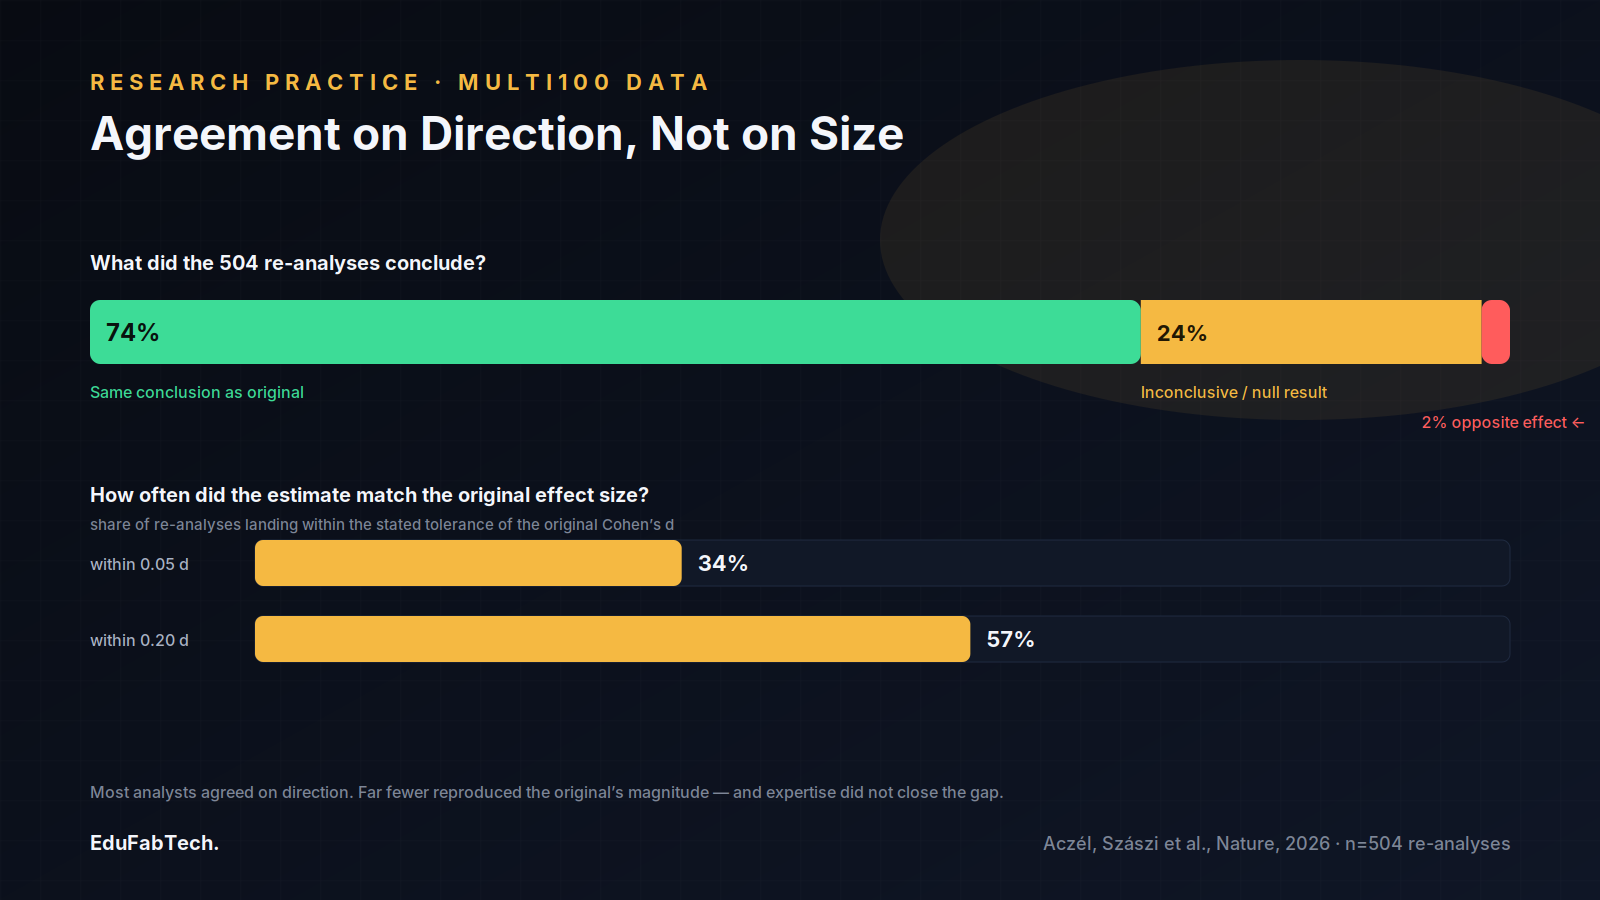
The headline numbers are worth sitting with. Across the 504 re-analyses, 74% reached the same qualitative conclusion as the original authors, 24% found an inconclusive or null result, and 2% found the opposite effect. That sounds like reasonable convergence until you tighten the standard: when the test was whether an analyst's estimate landed within a narrow band of the original effect size (within 0.05 of a Cohen's d), only 34% did; loosen that band fourfold and agreement rose to 57%. In other words, most analysts agreed on the direction of a finding, but a comfortable majority did not reproduce anything close to its magnitude. Expertise did not fix this: analysts with stronger statistical backgrounds did not converge with one another any more than less experienced ones did, and the disagreement did not shrink in studies built on larger samples.
This is not about fraud, and it is not new
Multi100 is the largest entry in a small but growing genre sometimes called "many-analysts" studies, and its predecessors matter for calibrating how surprised to be. In 2018, Raphael Silberzahn, Eric Uhlmann and 27 collaborating teams gave 29 independent teams (61 analysts total) one dataset and one question: are soccer referees more likely to issue red cards to dark-skinned players than light-skinned players? Every team used a defensible statistical approach. Estimated effect sizes ranged from an odds ratio of 0.89 to 2.93 — an almost fourfold spread — and the 29 teams collectively used 21 different combinations of covariates. Twenty teams found a significant effect; nine did not. Neither prior belief about the answer nor statistical seniority predicted which group an analyst landed in.
The pattern generalizes beyond human-subjects research. A 2025 study in BMC Biology led by Elliot Gould and colleagues recruited 174 analyst teams (246 analysts) in ecology and evolutionary biology and gave them two unpublished datasets — one on blue tit sibling number and nestling growth, one on Eucalyptus seedling recruitment under grass cover — with a shared research question for each. The result was the same shape of finding: substantial spread in effect sizes and model predictions, driven by differences in variable selection and random-effects structure that were not obviously wrong in any individual case. Put a soccer statistics question, a psychology question, and an ecology question through the same procedure, and you get the same lesson: a single analysis is one path through a much larger space of equally defensible analyses, not a unique, forced outcome of the data.
Where the variation actually comes from
The term researchers use for this space of options is analytical flexibility, or "researcher degrees of freedom" — decisions about how to clean data, which cases to exclude, which covariates to include, which model family to use, how to handle missing values, and how to define the outcome variable in the first place. None of these decisions is inherently improper. Each one, taken alone, is usually defensible. The problem is that a paper reports one path through that decision tree and rarely reports how much the result would have moved had a different, equally reasonable path been taken.
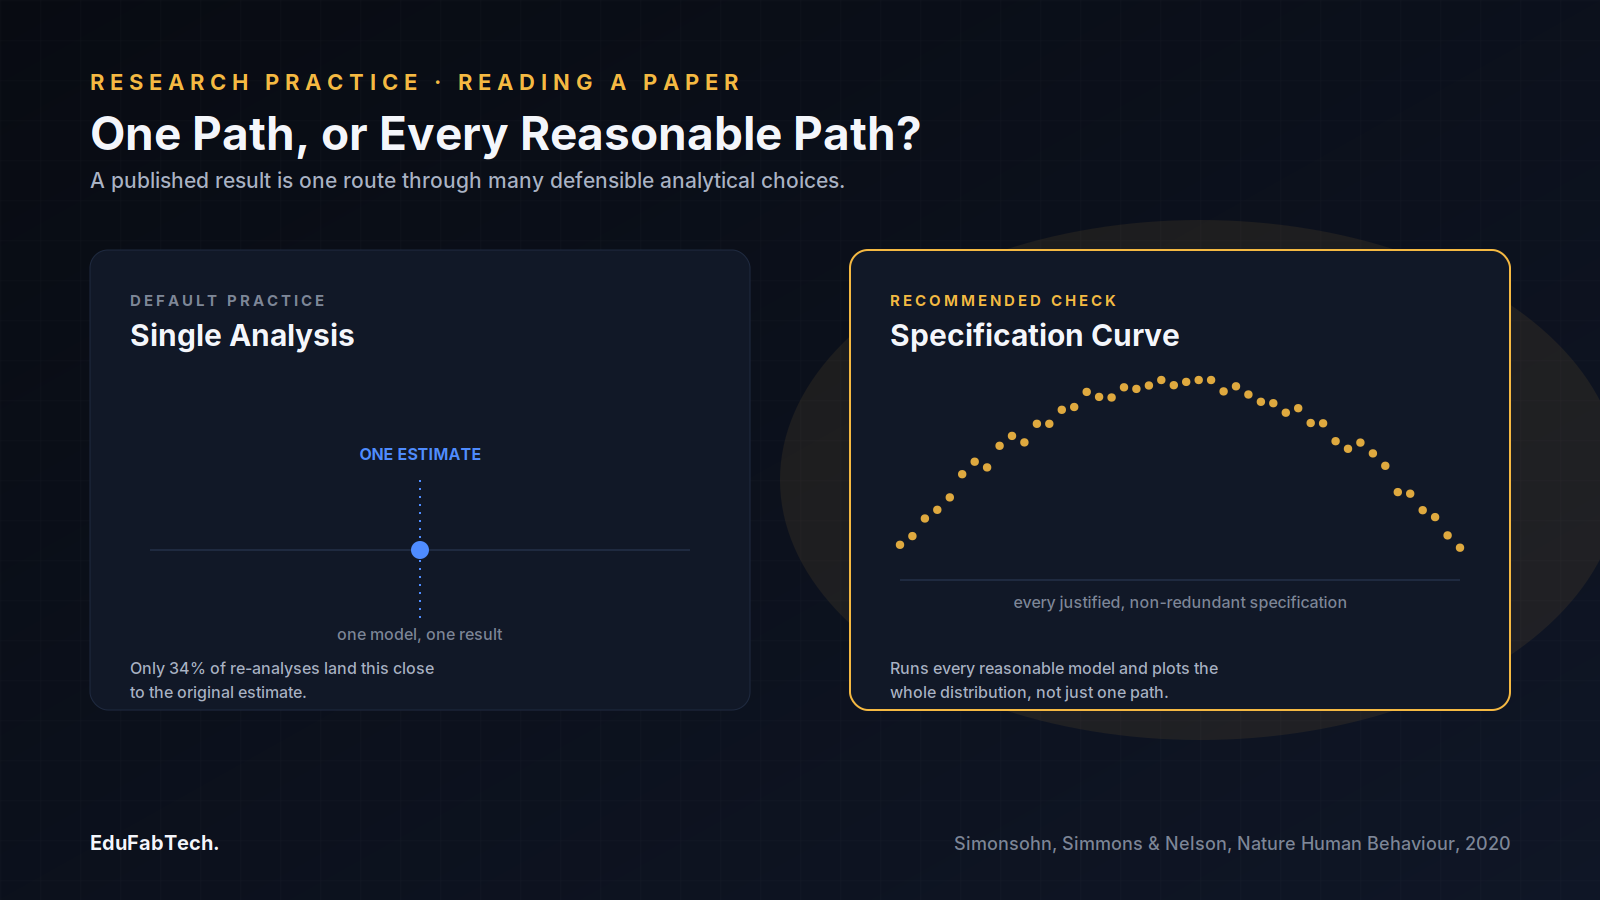
One practical response is to stop picking one path. Uri Simonsohn, Joseph Simmons and Leif Nelson formalized specification curve analysis in Nature Human Behaviour in 2020: instead of running one regression and reporting its p-value, the analyst enumerates every specification that is theoretically justified, statistically valid, and non-redundant, runs all of them, and plots the resulting distribution of effect sizes as a curve, alongside a joint inference test across the whole set. A finding that survives specification curve analysis is one that holds up across the reasonable alternatives an author could have chosen, not just the one they did choose. It will not appear in every paper you read, because it takes considerably more work than a single model, but its presence — or the presence of a simpler multiverse or robustness-check table — is one of the more reliable positive signals a reader can look for.
| Study | Field | Scale | Headline spread |
|---|---|---|---|
| Silberzahn et al., 2018 | Social psychology / sports data | 29 teams, 61 analysts, 1 dataset | Odds ratios from 0.89 to 2.93; 20 of 29 teams found a significant effect, 9 did not |
| Gould et al., 2025 | Ecology and evolutionary biology | 174 teams, 246 analysts, 2 datasets | Substantial heterogeneity in effect sizes and model predictions across both datasets |
| Aczél, Szászi et al., 2026 (Multi100) | Social and behavioral sciences | 457 analysts, 504 re-analyses, 100 studies | 74% same conclusion, 24% inconclusive, 2% opposite; only 34% matched the original effect size closely |
Reading a paper differently after this
None of this means a published effect is probably fake, and the Multi100 team is explicit that most re-analyses did not contradict the original authors — they landed somewhere between full agreement and inconclusive. What it means is that a single reported number carries less information than its precision suggests, and that the honest range around it is often wider than the confidence interval implies, because the confidence interval only captures sampling uncertainty, not the uncertainty introduced by which of many reasonable models was chosen. A few habits follow directly from that.
- Check whether the analysis plan was preregistered before the data were seen. Preregistration does not eliminate analytical flexibility, but it discloses which choices were made in advance versus after looking at the result.
- Look for a robustness or sensitivity section — alternative specifications, different exclusion criteria, a leave-one-out check. Its absence is not proof of a fragile result, but its presence is direct evidence the author checked.
- Separate direction from magnitude. Multi100 found much higher agreement on whether an effect existed than on how large it was; treat a paper's point estimate as more provisional than its qualitative conclusion.
- Ask whether the study is observational or experimental. Aczél and Szászi's team found observational studies, which involve more upstream data-cleaning and covariate decisions, produced more analytical variation than tightly controlled experiments.
- Treat reanalysis and replication as different tests. A replication collects new data under the same design; a reanalysis reruns different analytical choices on the same data. A result can survive one and not the other, and a paper's citations rarely tell you which kind of scrutiny, if any, it has already had.
What the studies themselves cannot tell you
The many-analysts design has its own limits, and treating it as a universal solvent would repeat the mistake it diagnoses. Analysts in these projects are volunteers who opted in, which is not a random sample of the field and may skew toward people already interested in methodological rigor. The Multi100 project draws its 100 studies from a fixed 2009–2018 window across a defined set of journals, originally sampled for the DARPA-funded Systematizing Confidence in Open Research and Evidence program, whose stated aim is to produce automated confidence scores for defense-relevant policy use — a purpose worth knowing when judging why this particular pool of claims was assembled, not a reason to discount the re-analysis numbers themselves. And a many-analysts study answers "how much does this result move under different reasonable analyses of the same data," which is a narrower question than "is this result true." It says nothing about measurement validity, sampling bias, or whether the original data collection itself was sound — those failures don't show up when everyone is working from the same file.
What the accumulating evidence does support is a specific, teachable adjustment to how a single statistic should be read. A p-value or an effect size in a results table is the output of one route through a tree of decisions that was almost never fully disclosed and, per Multi100, would very plausibly have produced a different number down a different route. That is not an argument for distrusting quantitative research; it is an argument for reading it the way the analysts in these studies were forced to work — by asking what else the same data could have shown, and by treating a single number, however precisely reported, as one draw from a wider and mostly invisible distribution of honest answers.
- Balázs Aczél, Barnabás Szászi, et al.. Investigating the analytical robustness of the social and behavioural sciences. Nature, 2026. doi:10.1038/s41586-025-09844-9
- Raphael Silberzahn, Eric L. Uhlmann, Dan P. Martin, et al.. Many Analysts, One Data Set: Making Transparent How Variations in Analytic Choices Affect Results. Advances in Methods and Practices in Psychological Science, 2018. doi:10.1177/2515245917747646
- Elliot Gould, Hannah S. Fraser, Timothy H. Parker, et al.. Same data, different analysts: variation in effect sizes due to analytical decisions in ecology and evolutionary biology. BMC Biology, 2025. doi:10.1186/s12915-024-02101-x
- Uri Simonsohn, Joseph P. Simmons, Leif D. Nelson. Specification Curve Analysis. Nature Human Behaviour, 2020. doi:10.1038/s41562-020-0912-z
- Defense Advanced Research Projects Agency. Systematizing Confidence in Open Research and Evidence (SCORE). DARPA, 2019. link