NOAA and Copernicus: October 2026 Was Earth's Warmest October on Record
NOAA's NCEI and the EU's Copernicus service, reporting on 12 and 5 November 2026, both found last month broke the global temperature record as a strong-to-very-strong El Niño builds in the Pacific.
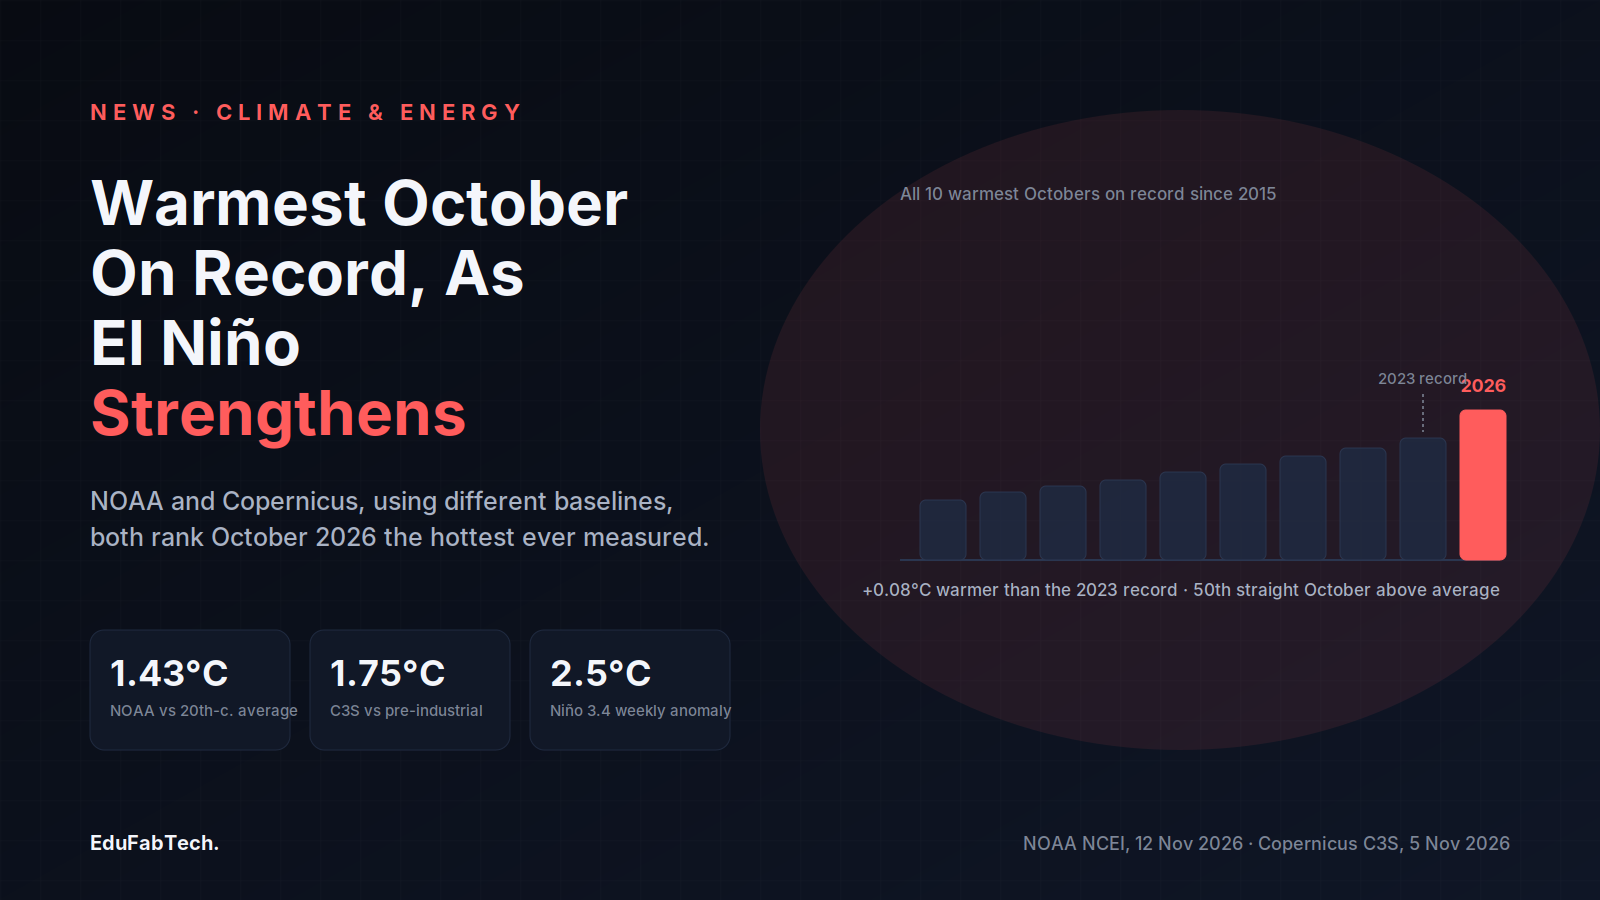
NOAA's National Centers for Environmental Information (NCEI) reported on 12 November 2026 that October 2026 was the warmest October in its global temperature record, which runs back to 1850. The global surface temperature was 1.43°C (2.57°F) above the 20th-century average, the agency said — the highest departure from average recorded for any month in that 177-year dataset, and 0.08°C warmer than the previous October record set in 2023.
NCEI's breakdown shows the land surface running 2.08°C above its 20th-century October average, the third-highest such figure on record, while the global ocean surface averaged 1.14°C above its own long-term average — the highest departure measured for any month, edging past September 2026's mark by 0.04°C. October 2026 was the 50th consecutive October with temperatures above the 20th-century average, and NCEI notes that all ten of the warmest Octobers in the record have occurred since 2015. The January–October period was the second-warmest such stretch in the 177-year record, behind only the same months in 2024, NCEI said.
An independent dataset reaches the same conclusion
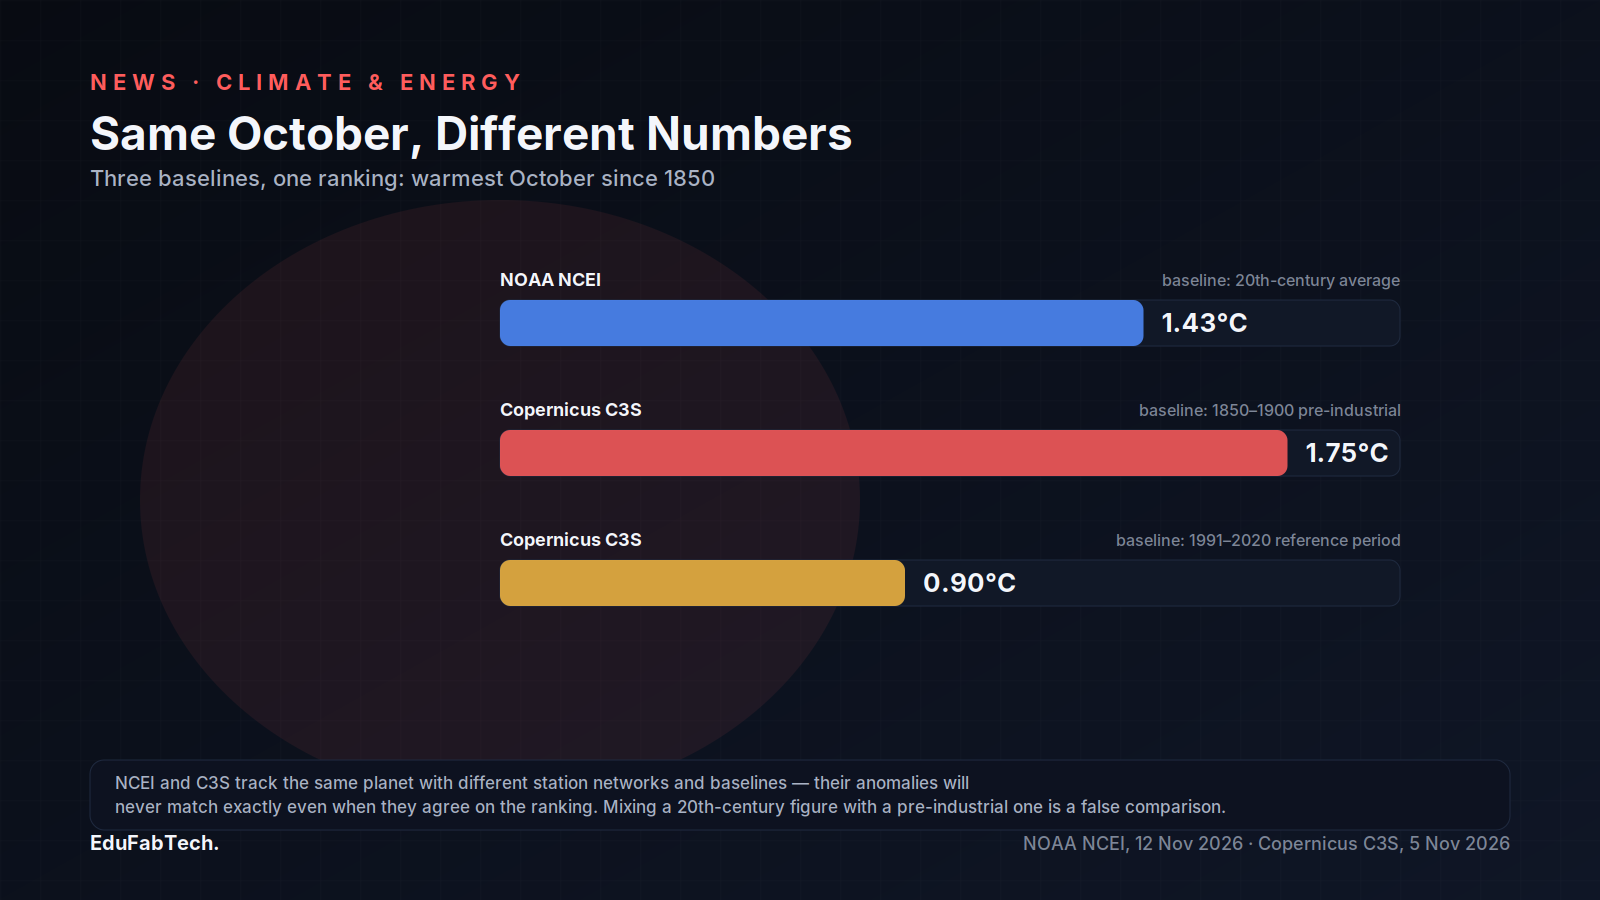
The European Union's Copernicus Climate Change Service (C3S), run by the European Centre for Medium-Range Weather Forecasts (ECMWF), published its own October assessment on 5 November 2026 and arrived at the same ranking using a different baseline and dataset. C3S put October 2026 at 1.75°C above the 1850–1900 pre-industrial average and 0.90°C above the 1991–2020 reference period, with a monthly mean of 15.35°C. "October has continued the pattern of remarkable global warmth, with record global and surface ocean temperatures," said Samantha Burgess, Strategic Lead for Climate at ECMWF, in the C3S statement.
C3S also tracked ocean heat: the average sea surface temperature across the extra-polar oceans (60°S–60°N) reached 20.95°C in October, a record for the month, while the Niño 3.4 region of the tropical Pacific averaged 29.94°C, a monthly anomaly of 3.21°C above the 1991–2020 average and an all-time high for that index. October 2026 was the third consecutive month with global temperatures above the 1.5°C threshold referenced in the Paris Agreement, and C3S states it is now "virtually certain" — a probability above 99% — that the full year 2026 will finish between 1.56°C and 1.61°C above the pre-industrial baseline.
A strengthening El Niño in the Pacific
Both agencies point to the same driver: the El Niño event now under way in the tropical Pacific. In its ENSO Diagnostic Discussion issued on 12 November 2026, NOAA's Climate Prediction Center reported a weekly Niño 3.4 sea surface temperature anomaly of 2.5°C and forecast a "strong-to-very strong El Niño" persisting through January–March 2027 with better than a 79% chance of that strength holding. The discussion also put the probability at around 60% that the event will exceed every previous El Niño dating back to 1950, measured by a relative Niño index of 2.5°C or higher over the October–December and November–January three-month windows — a threshold the discussion says has not been reached in that record. The Center's outlook expects the event to keep strengthening before beginning to weaken in early 2027.
| Source | Metric | October 2026 value | Baseline |
|---|---|---|---|
| NOAA NCEI | Global surface anomaly | 1.43°C | 20th-century average |
| Copernicus C3S | Global surface anomaly | 1.75°C | 1850–1900 |
| Copernicus C3S | Global surface anomaly | 0.90°C | 1991–2020 |
| NOAA CPC | Niño 3.4 weekly SST anomaly | 2.5°C | 1991–2020 |
What it means for students and researchers
For anyone working with these datasets, the October reports are a reminder that NCEI and C3S measure the same planet with different baselines and station networks, which is why their anomaly figures never match exactly even when their rankings agree. Reproducing either agency's ranking claim requires pulling the specific baseline period cited in the source — mixing a 20th-century-average figure with a pre-industrial one produces a false comparison.
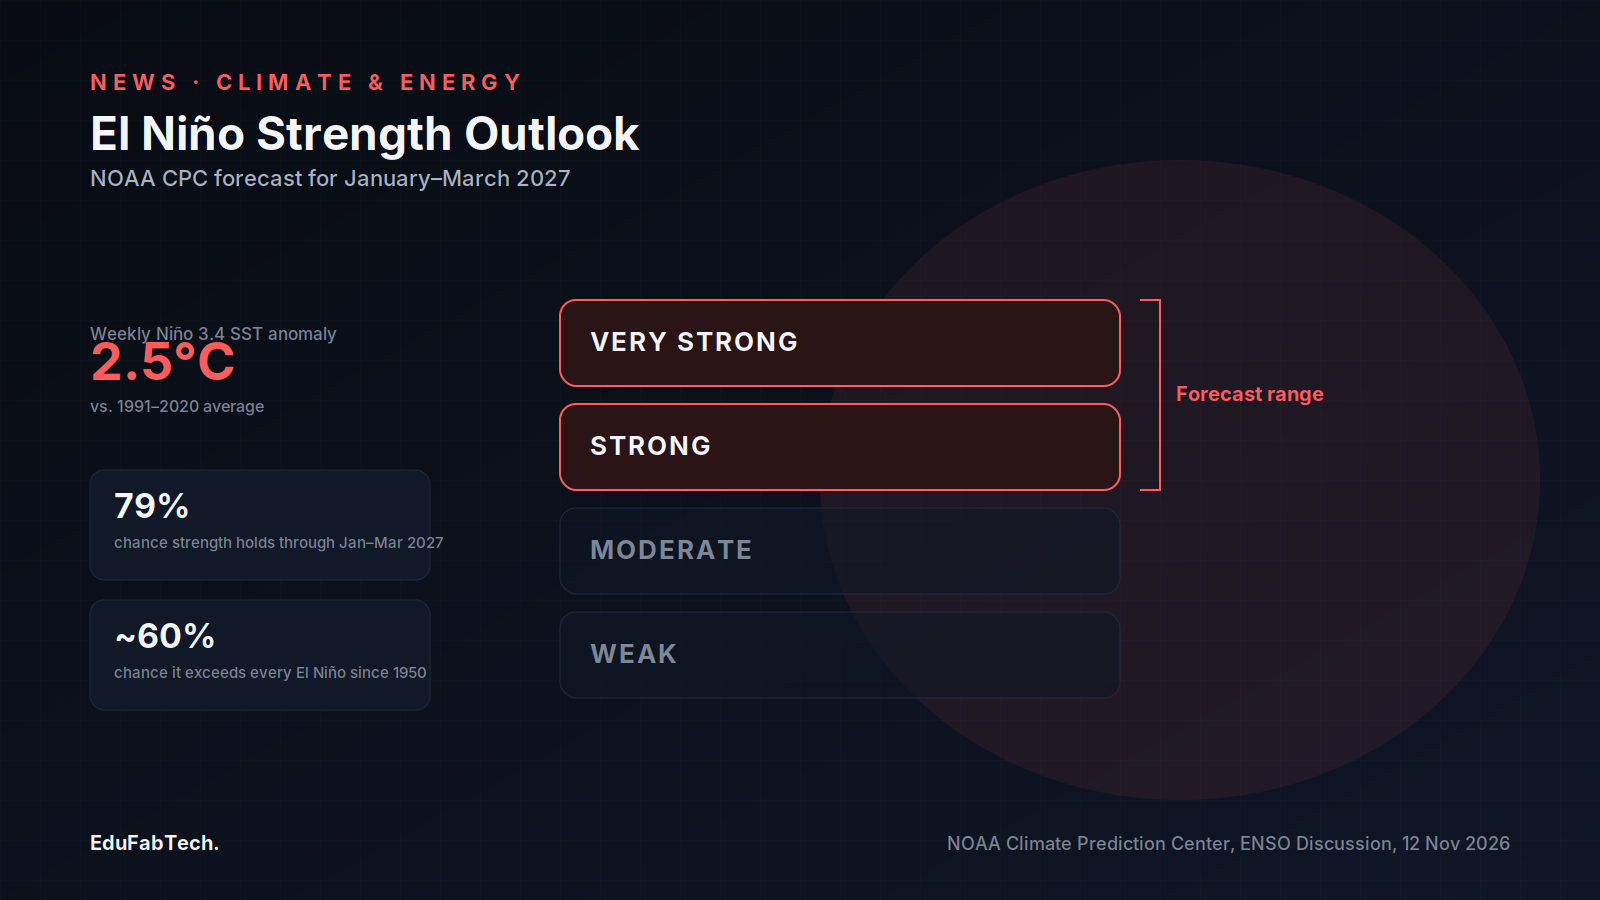
The El Niño discussion is also a live case study in forecast communication: the Climate Prediction Center uses precise, probability-bound language — "strong-to-very strong" — rather than a single descriptive label. Researchers tracking ENSO's effects on rainfall, crop yields or disease transmission have a clear primary document to cite rather than secondary paraphrases. NOAA's Climate Prediction Center's next ENSO update is scheduled for 10 December 2026, with the current outlook pointing to peak strength before the event begins to weaken in early 2027.
A quick question for readers
How much do you spend on books and course materials per term?
Amounts in US dollars. The results help show how much course materials really cost students.
Pick an answer, create a free account in a minute, and your vote counts. Already a member? Sign in
Comments 3
Comment-
The baseline-mixing warning in here is the part worth sitting with, because the article itself hands you two numbers that look like they con…
-
The baseline-mismatch warning buried near the bottom is the most useful line in the piece: 1.43°C against the 20th-century average and 1.75°…
-
What jumps out is the baseline laundering problem the piece flags: NCEI's 1.43°C is against the 20th-century average, Copernicus's 1.75°C is…
Join free to read the full comments and reply Comments are between members; an account takes a minute.
Source: NOAA National Centers for Environmental Information
Sources (3)
- NOAA National Centers for Environmental Information. Monitoring Global Temperature and Precipitation in October 2026. NOAA NCEI, 2026. ncei.noaa.gov ↗ · checked 15 Nov 2026
- Copernicus Climate Change Service / ECMWF. Copernicus: Warmest October on record with 2026 virtually certain to exceed 1.5°C. Copernicus Climate Change Service, 2026. climate.copernicus.eu ↗ · checked 15 Nov 2026
- NOAA Climate Prediction Center. El Niño/Southern Oscillation (ENSO) Diagnostic Discussion, issued 12 November 2026. NOAA Climate Prediction Center, 2026. cpc.ncep.noaa.gov ↗ · checked 15 Nov 2026