Reproducible, Robust, Replicable: What a 3,900-Claim Audit of Social Science Found
A seven-year, DARPA-funded effort tested the same claims three different ways — and got three different answers, which is itself the lesson for anyone reading a single study.
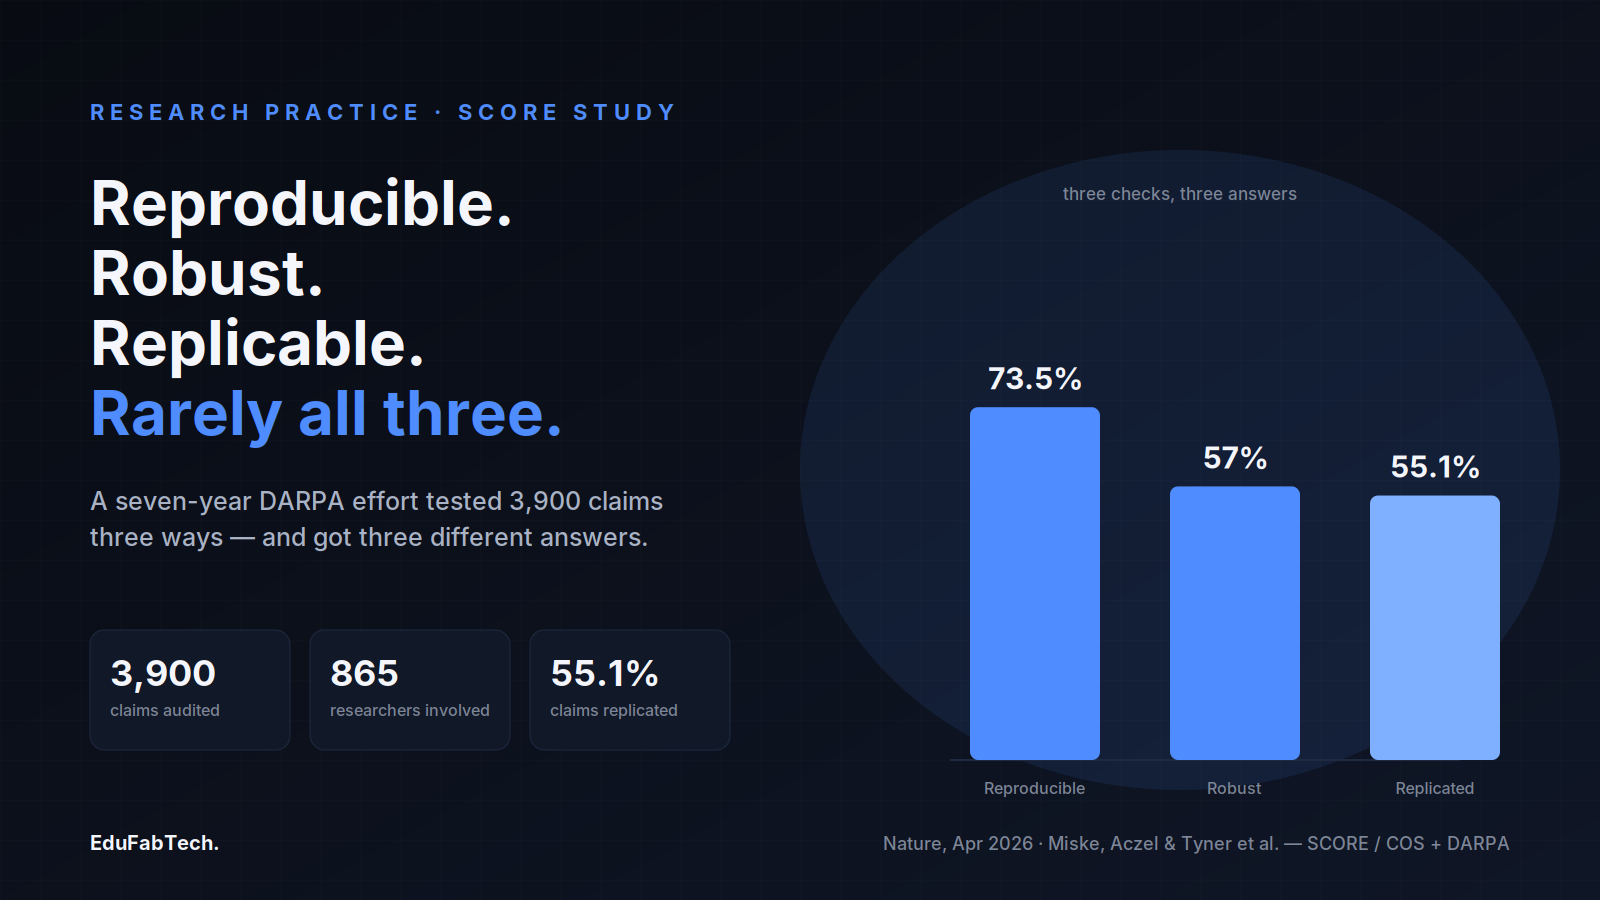
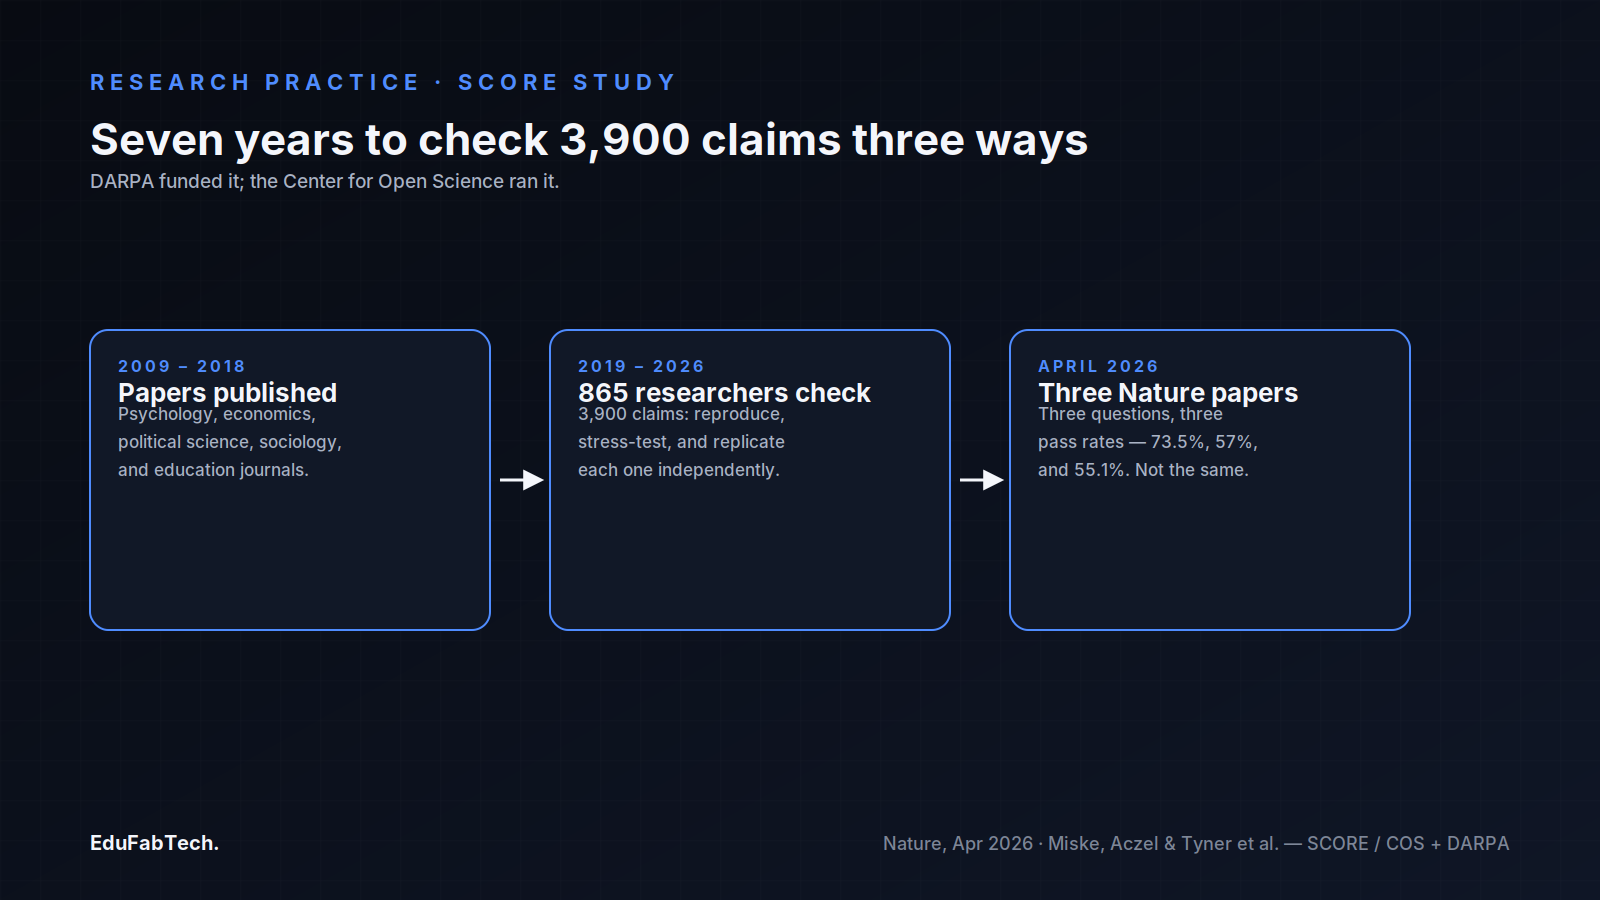
In April 2026, three papers appeared together in Nature, the result of a seven-year, 865-researcher effort to answer a question that sounds simple and turns out not to be: if you hand a published social-science claim to independent teams and ask them to check it, how often does it hold up? The project is called SCORE, short for Systematizing Confidence in Open Research and Evidence, funded by the US Defense Advanced Research Projects Agency and coordinated by the Center for Open Science. It drew a stratified random sample of roughly 3,900 claims from papers published between 2009 and 2018 across dozens of journals in psychology, economics, political science, sociology, education, and related fields, and it checked them three separate ways.
The headline is not a single pass/fail number. It is that the three checks — reproducing a result from the original data, testing whether it survives reasonable alternative analytical choices, and replicating it with new data — produced three different pictures of the same body of work, and the three pictures only weakly track one another. That divergence is the most useful thing in the trilogy for anyone who reads research rather than produces it, because it maps directly onto the questions worth asking of any single paper in front of you.
Three checks, not one
The words "reproducible" and "replicable" get used interchangeably in casual conversation, but the SCORE papers keep them apart on purpose, and the distinction is worth holding onto. Reproducibility asks whether you can take the original data and the original code and get the original number back out. Analytical robustness asks whether a different, equally defensible analyst working on the same data would have gotten a similar answer. Replicability asks whether the underlying effect shows up again when someone collects new data and runs the same test. A result can pass one of these and fail the other two.
| Question asked | Sample | What SCORE found |
|---|---|---|
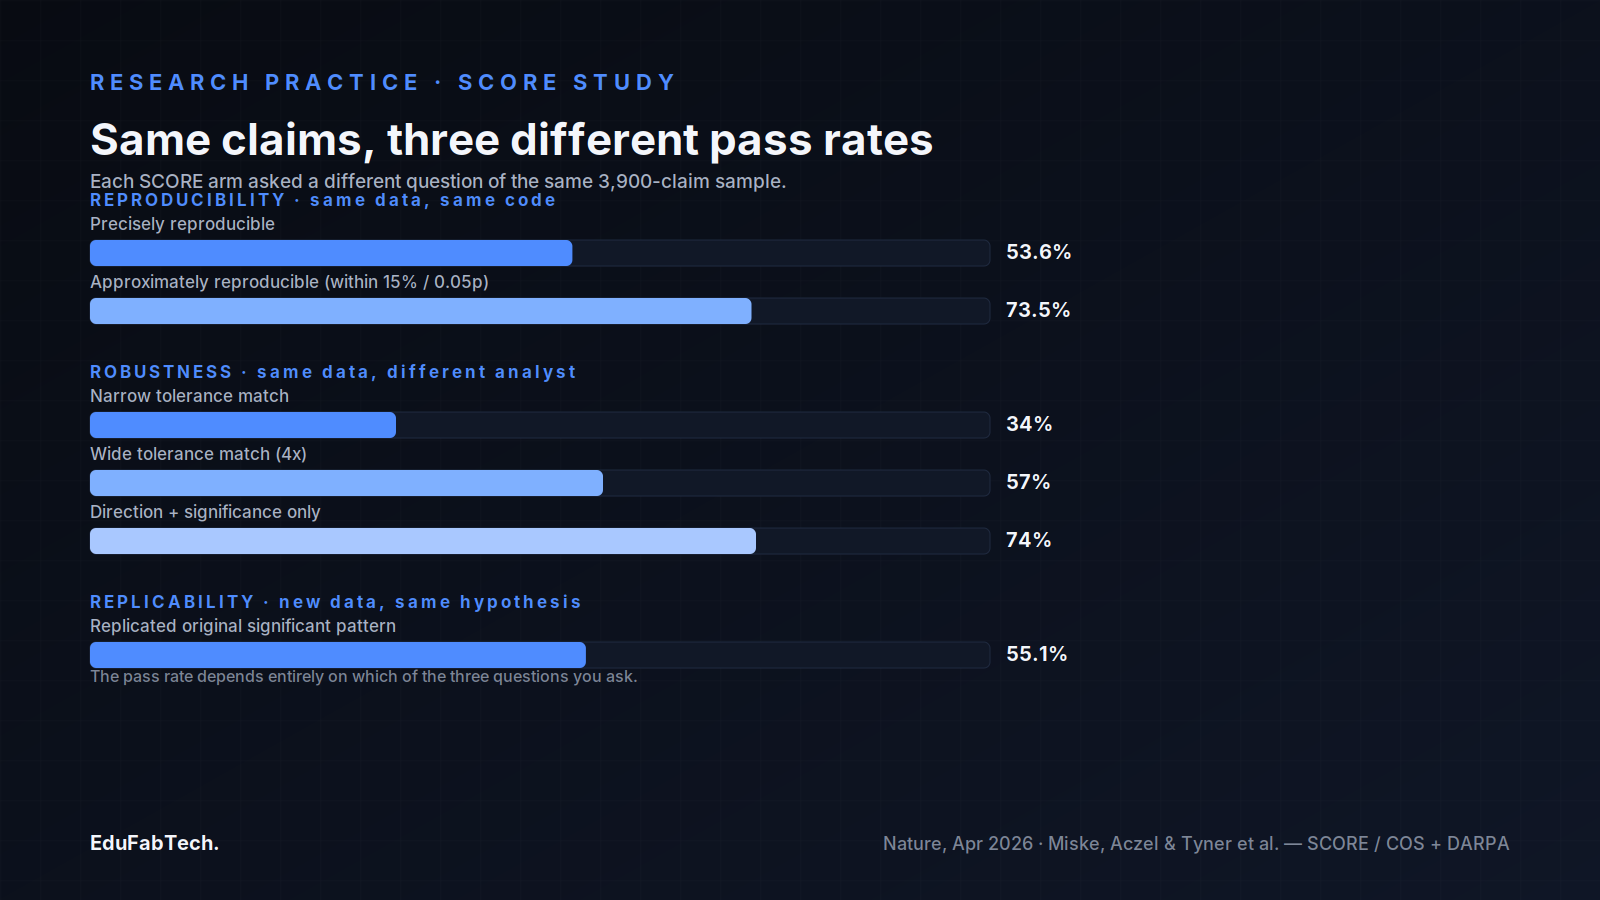
| Reproducibility: same data, same code, same number? | 600 papers; 143 datasets actually assessable | 53.6% precisely reproducible, 73.5% approximately reproducible |
| Robustness: same data, different reasonable analysis? | 100 studies, 5+ independent reanalysts each | 34% matched within a narrow tolerance, 57% within a wider one, 74% agreed on direction and significance |
| Replicability: new data, same hypothesis? | 274 claims from 164 papers | 55.1% of claims replicated the original significant pattern |
What each of the three papers found
The reproducibility arm, led by Olivia Miske and colleagues at the Center for Open Science and published in Nature in 2026, started from an uncomfortable baseline: only 24.0% of the 600 sampled papers had data available to reanalyze at all, a figure the authors report with a 95% confidence interval of 20.8–27.6%. Of the datasets researchers could actually obtain, 53.6% were rated precisely reproducible and 73.5% at least approximately reproducible, meaning within 15% of the original effect or 0.05 of the original p-value. The same paper found that the share of these journals with mandatory data-sharing policies rose from 27% in 2018 to 52% in 2025, and that papers from journals requiring data sharing were markedly more likely to reproduce cleanly — a correlation the University of Stirling's 2026 summary of the study singled out as its clearest practical lesson.
The robustness arm, led by Balazs Aczel and colleagues and also published in Nature in 2026, took a different cut: for 100 studies, at least five independent analysts each reanalyzed the same original data for a single claim, without coordinating with one another. Only 34% of those reanalyses landed within a narrow tolerance band of the original effect size; widening the tolerance fourfold brought that up to 57%, and looking only at whether the reanalysis agreed on direction and statistical significance — a much looser bar — brought it to 74%. In other words, even when nothing about the data or the hypothesis changes, the specific sequence of decisions an analyst makes along the way moves the answer.
The replicability arm, led by Andrew H. Tyner and colleagues and published in Nature in 2026, is the one closest to what most people mean by "does this hold up": new samples, new data collection, same hypothesis. Of 274 claims drawn from 164 papers in 54 journals, 55.1% replicated the original statistically significant pattern, and the replications were high-powered by design, with a median statistical power of 99.6% to detect the original effect size. Even among the claims that did replicate, the effect shrank: the median Pearson's r fell from 0.25 in the original studies to 0.10 in the replications, an 82.4% reduction in shared variance between the two variables. A result reappearing at a fraction of its original size is a different outcome than a result reappearing at full strength, even though both would be reported as "replicated" in a simple count.
Why analytical choices move the answer almost as much as new data does
The robustness finding is easy to read as an abstraction until you see it applied to a concrete dataset. A 2025 study in BMC Biology by Elliot Gould, Hannah Fraser, Timothy Parker and colleagues ran a similar exercise in ecology: 174 independent analyst teams, comprising 246 analysts in total, were given two identical, unpublished datasets — one on blue tit nestling growth, one on eucalypt seedling recruitment — and asked to test the same prespecified questions. The spread of results was not a scatter of noise around a shared answer. For the blue tit data, effect-size estimates ran nearly continuously from large negative to statistically significant positive, and for the eucalypt data, roughly a third of the analyses crossed the significance threshold in one direction or the other depending on which of several defensible modeling choices an analyst made. Crucially, the teams whose results were outliers were not using visibly worse methods than the teams who landed near the average; they were using different, individually reasonable methods.
Read alongside the SCORE robustness paper, the ecology study makes the same point from a separate field with a separate design: a single analysis is one path through a space of decisions — which covariates to include, which observations to exclude, which model family to use — and a different, equally justifiable path can lead somewhere else. That is not evidence of misconduct. It is evidence that "the" result of a study is often really one result among several plausible ones, and a paper that reports only its chosen path is not showing you the range.
Can readers see it coming?
SCORE also tested whether researchers' intuitions track any of this, using prediction markets and surveys — a separate strand that predates the 2026 papers. In a 2020 study in Royal Society Open Science, Michael Gordon and colleagues had forecasters predict field-by-field replication rates before the results existed; the crowd's aggregate forecast for the overall replication rate was 49%, strikingly close to the 55.1% figure the 2026 replicability paper eventually reported years later. Forecasters also correctly expected economics to replicate at a higher rate (58% predicted) than psychology or education (42% predicted for both), a pattern the final results bore out in direction if not in exact magnitude.
That success should be read with a caution attached. A separate 2021 study in the same journal by Domenico Viganola and colleagues tested prediction markets and surveys against a different DARPA social-science program and found the forecasts performed poorly there: the correlation between market prices and actual outcomes was not statistically distinguishable from zero (Spearman's rho = 0.31, p = 0.17), a sharp contrast with the roughly 73% accuracy achieved in earlier replication forecasting exercises the same authors cite. Aggregated expert judgment can track broad, field-level patterns reasonably well while still failing to call individual cases — which is exactly the granularity at which most people read research: one paper at a time.
A working checklist
None of this is a reason to distrust the social and behavioural sciences wholesale, and the SCORE authors are explicit that it is not their conclusion either. It is a reason to read a single study the way the SCORE design implies you should, by asking which of the three questions the paper in front of you has actually answered:
- Are the data and analysis code available, and did anyone besides the original authors run the code? Availability is not the same as verification, but SCORE's reproducibility paper found the former is a precondition almost nothing gets checked without.
- Does the paper show, or at least discuss, whether the result survives reasonable alternative specifications — different covariates, different exclusion rules, different model families? A single reported specification is one path through a decision space, not proof there was only one path.
- Has the finding been tested with new data by anyone other than the original team, and if so, what happened to the effect size, not just the p-value? A replication that halves the original effect is telling you something different from one that reproduces it in full.
- Is the claimed effect size large relative to typical shrinkage on replication? A median drop from r = 0.25 to r = 0.10 across the 2026 replicability sample is a useful prior for how much to discount an unreplicated finding, not a rule that applies to every individual case.
- Does the field or journal require data sharing? The 2026 reproducibility paper's clearest correlate of reproducibility was exactly this policy, not the prestige of the journal or the size of the sample.
What the numbers do not mean
The SCORE sample is bounded in ways worth stating plainly: it covers quantitative papers published from 2009 to 2018 in social and behavioural science journals, so it says nothing directly about work published after 2018, about qualitative research, or about the natural and physical sciences, where reproducibility studies have produced their own, not directly comparable figures. A finding that reproduces precisely from the original data and code has also not been shown to be theoretically valid, generalizable beyond the sampled population, or measured with a valid instrument — reproducibility is a check on arithmetic and process, not on whether the underlying idea is correct. Tim Errington, senior director of research at the Center for Open Science, put the broader point plainly when the results were released in 2026: "research is hard, and in some ways the hard work begins after making a discovery." The project's own synthesis goes further, stating that credibility is multidimensional and that no single number — not a reproducibility rate, not a replication rate, not a robustness score — stands in for the others.
That is the practical takeaway for anyone evaluating a study rather than running one. A claim that has been reproduced, stress-tested against alternative analyses, and replicated with new data at close to its original effect size has cleared three independent hurdles that most published findings, including many well-cited ones, have not all cleared at once. Asking which of the three a given paper has actually passed — rather than assuming a peer-reviewed result has passed all of them by default — is a more calibrated way to read the literature than either blanket trust or blanket skepticism.
- Olivia Miske, Anna Lou Abatayo, Mason Daley, et al.. Investigating the reproducibility of the social and behavioural sciences. Nature, 2026. doi:10.1038/s41586-026-10203-5
- Balazs Aczel, Barnabas Szaszi, Harry T. Clelland, et al.. Investigating the analytical robustness of the social and behavioural sciences. Nature, 2026. doi:10.1038/s41586-025-09844-9
- Andrew H. Tyner et al.. Investigating the replicability of the social and behavioural sciences. Nature, 2026. doi:10.1038/s41586-025-10078-y
- Elliot Gould, Hannah S. Fraser, Timothy H. Parker, et al.. Same data, different analysts: variation in effect sizes due to analytical decisions in ecology and evolutionary biology. BMC Biology, 2025. doi:10.1186/s12915-024-02101-x
- Michael Gordon, Domenico Viganola, Michael Bishop, et al.. Are replication rates the same across academic fields? Community forecasts from the DARPA SCORE programme. Royal Society Open Science, 2020. doi:10.1098/rsos.200566
- Domenico Viganola, Gordon Buckles, Yiling Chen, et al.. Using prediction markets to predict the outcomes in the Defense Advanced Research Projects Agency's next-generation social science programme. Royal Society Open Science, 2021. doi:10.1098/rsos.181308
- University of Stirling. Landmark study shows data sharing key to reproducibility across Social and behavioural sciences. University of Stirling, 2026. link
- Center for Open Science. SCORE: Systematizing Confidence in Open Research and Evidence. Center for Open Science, 2026. link
- Center for Open Science. Large-scale collaboration releases new findings on research credibility. Center for Open Science, 2026. link