One Dataset, 13 Verdicts: A 274-Claim Replication Study and What the Metric Changes
A Nature paper that tried to replicate 274 social-science claims found success rates from 28.6% to 74.8% on the same data, depending only on which of thirteen statistical criteria defined "replicated."
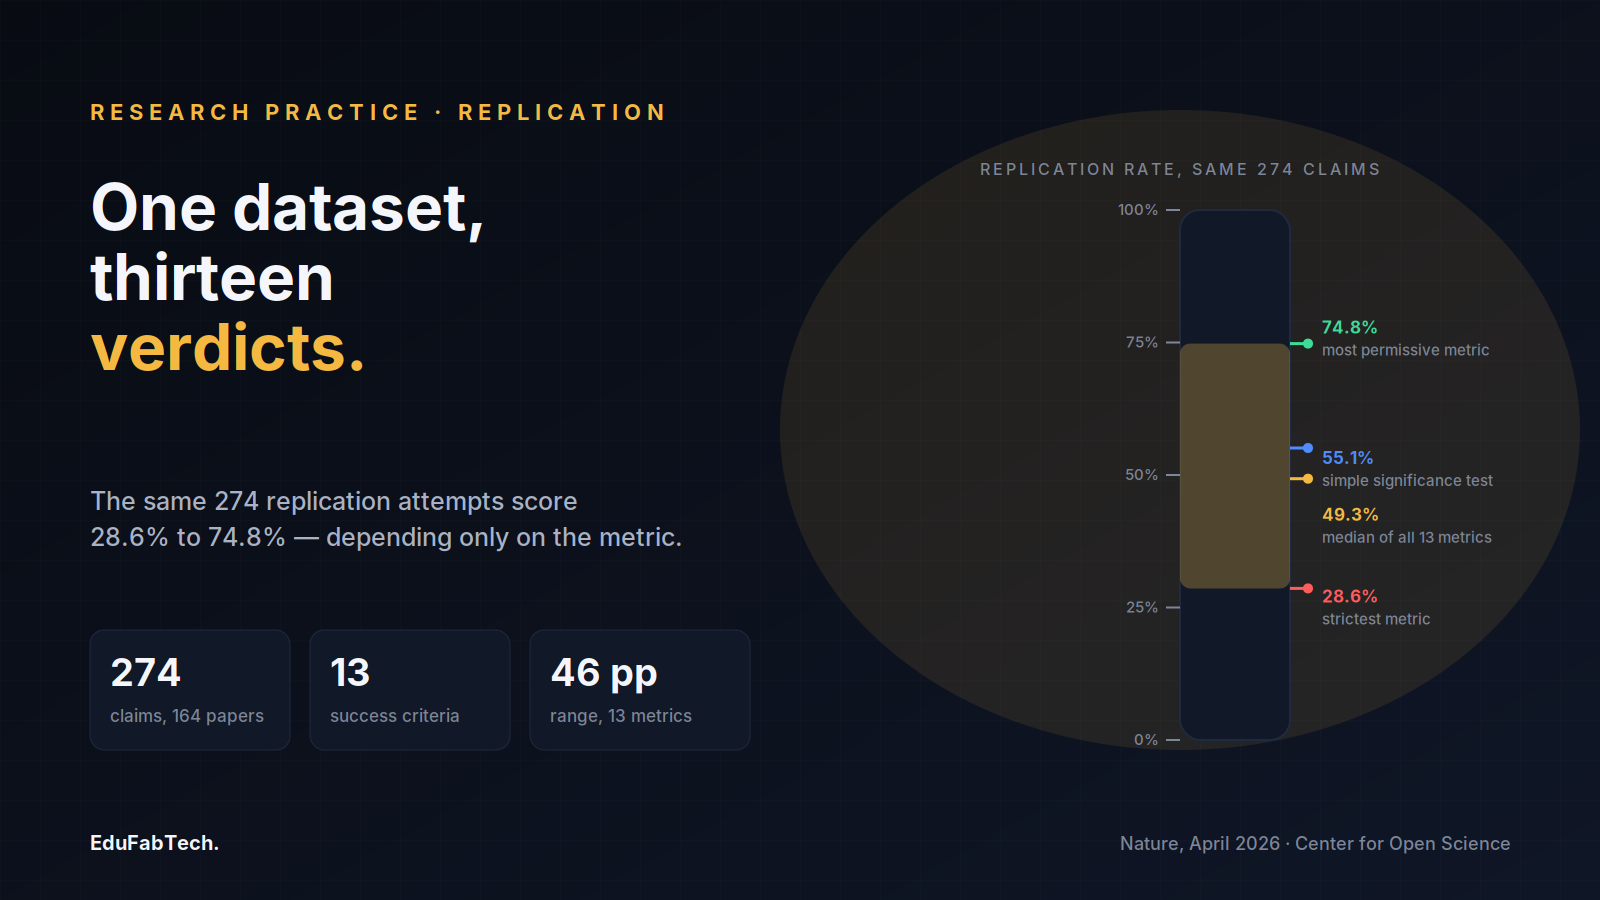
In April 2026, a Nature paper reported something that is easy to misread as a single number. A team led by Andrew H. Tyner, Anna Lou Abatayo and Mason Daley, with Brian Nosek of the Center for Open Science as corresponding author, tried to replicate 274 claims drawn from 164 quantitative papers published between 2009 and 2018 in 54 journals across twelve disciplines, from economics to psychology to public administration. Counted the most common way — a statistically significant result in the same direction as the original — 151 of those 274 claims held up, a success rate of 55.1%. Weighted so that papers with several claims do not dominate the tally, the figure drops to 49.3%, with a 95% confidence interval of 43.8% to 54.7%, as reported in Nature (2026).
That is the number most coverage settled on. Earth.com's report on the paper adds that success rates varied by field, from 42.5% to 63.1% across the twelve disciplines sampled. But the paper itself did something more useful for anyone trying to read a replication study correctly: it did not apply one definition of "successful replication" and stop. It applied thirteen.
Run the same 274 attempts through all thirteen criteria, and the replication rate stops being a fixed point and becomes a range: from 28.6% up to 74.8%, with a median across methods of 49.3%, according to the same Nature paper. A reader who only sees one of those numbers in a headline has no way of knowing whether it sits near the pessimistic end, the optimistic end, or the middle — and the paper's own point is that none of the thirteen has been agreed on as the right one.
Three different questions, not one
The reason the estimates spread so widely is that the thirteen metrics are not thirteen versions of the same question. A 2026 paper in PLOS ONE by Robbie van Aert, Marcel van Assen and Rubén López-Nicolás, which re-analysed the SCORE replication data statistically, groups the methods into two families. One family asks whether the original and the replication agree on the basic conclusion: is there a statistically significant effect, in the same direction, in both studies? That is the simplest test, and the one most coverage quotes, but it is also the most sensitive to how well-powered each study happened to be.
The second family asks a different question: are the true effect sizes similar, not just the yes/no verdicts? Under this family sit methods such as checking whether the original effect size falls inside the replication's 95% confidence interval, prediction-interval and Q-test approaches that formally test whether two studies could share one true effect, equivalence tests that define in advance how close two effects must be to count as "the same," and meta-analytic methods — including what the paper calls hybrid and HYEMA approaches — that pool the original and replication results while correcting for the fact that the original was selected partly because it was statistically significant. Van Aert and colleagues find that methods in the first family struggle specifically when the true effect is zero or small and the sample sizes of both the original study and the replication are not very large — conditions that describe much of the social-science replication literature — and conclude that there is "often insufficient information in one original study and one replication for drawing definite conclusions" by any single method, as stated in their PLOS ONE paper.
That is not a technicality. It means a replication project can truthfully report that "49% succeeded" and that "75% succeeded" from identical data, depending only on which of these two questions it decided to answer. Neither number is wrong. They are answers to different questions wearing the same word, "replicated."
The effect sizes shrank regardless of which test you used
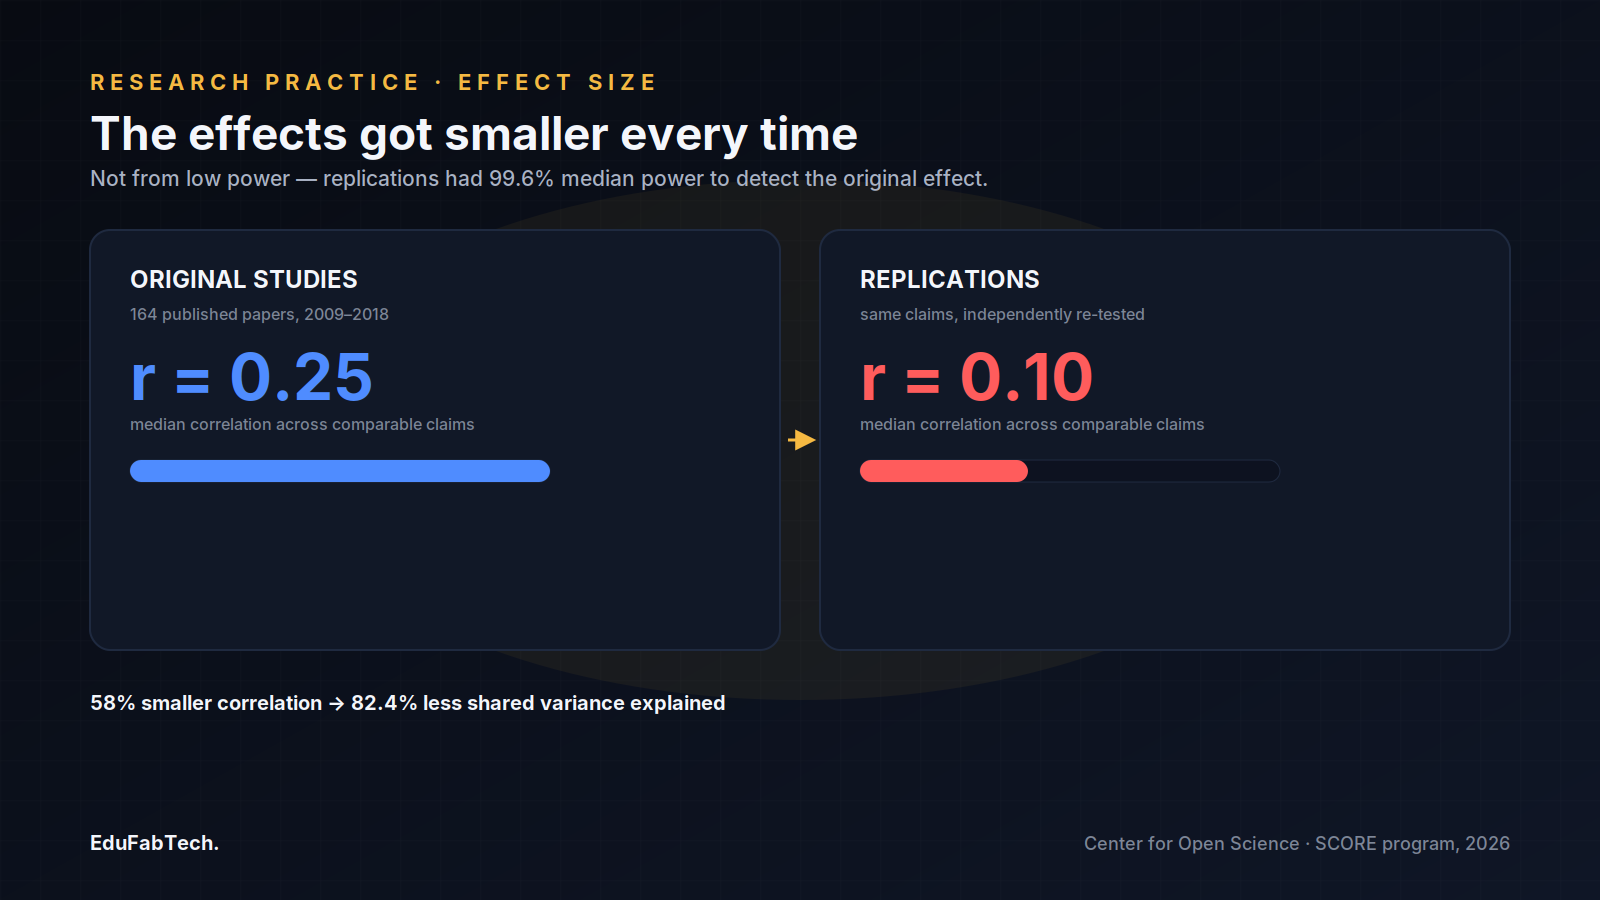
One statistic in the Nature paper does not depend on which of the thirteen criteria is applied, because it is not a pass/fail count at all. Across the claims that could be compared, the median effect size in the original studies, measured as Pearson's r, was 0.25; in the replications it was 0.10. That is a reduction of roughly 58% in the correlation itself, and, because shared variance scales with the square of r, an 82.4% reduction in the variance the two sets of studies were said to explain, as reported in the Center for Open Science's account of the findings.
This matters for a specific reason: the replications were not underpowered relative to the originals. The replication attempts had a median statistical power of 99.6% to detect the effect size the original study had reported, per the same Center for Open Science summary. A replication that is almost certain to detect the original effect, and still measures an effect less than half as large, is not failing to find something that was there. It is evidence that many of the original published effect sizes were inflated — consistent with what researchers call a winner's curse, in which effects large enough to clear a significance threshold in a small sample are, on average, larger than the true effect.
Two companion studies, two more sliding scales
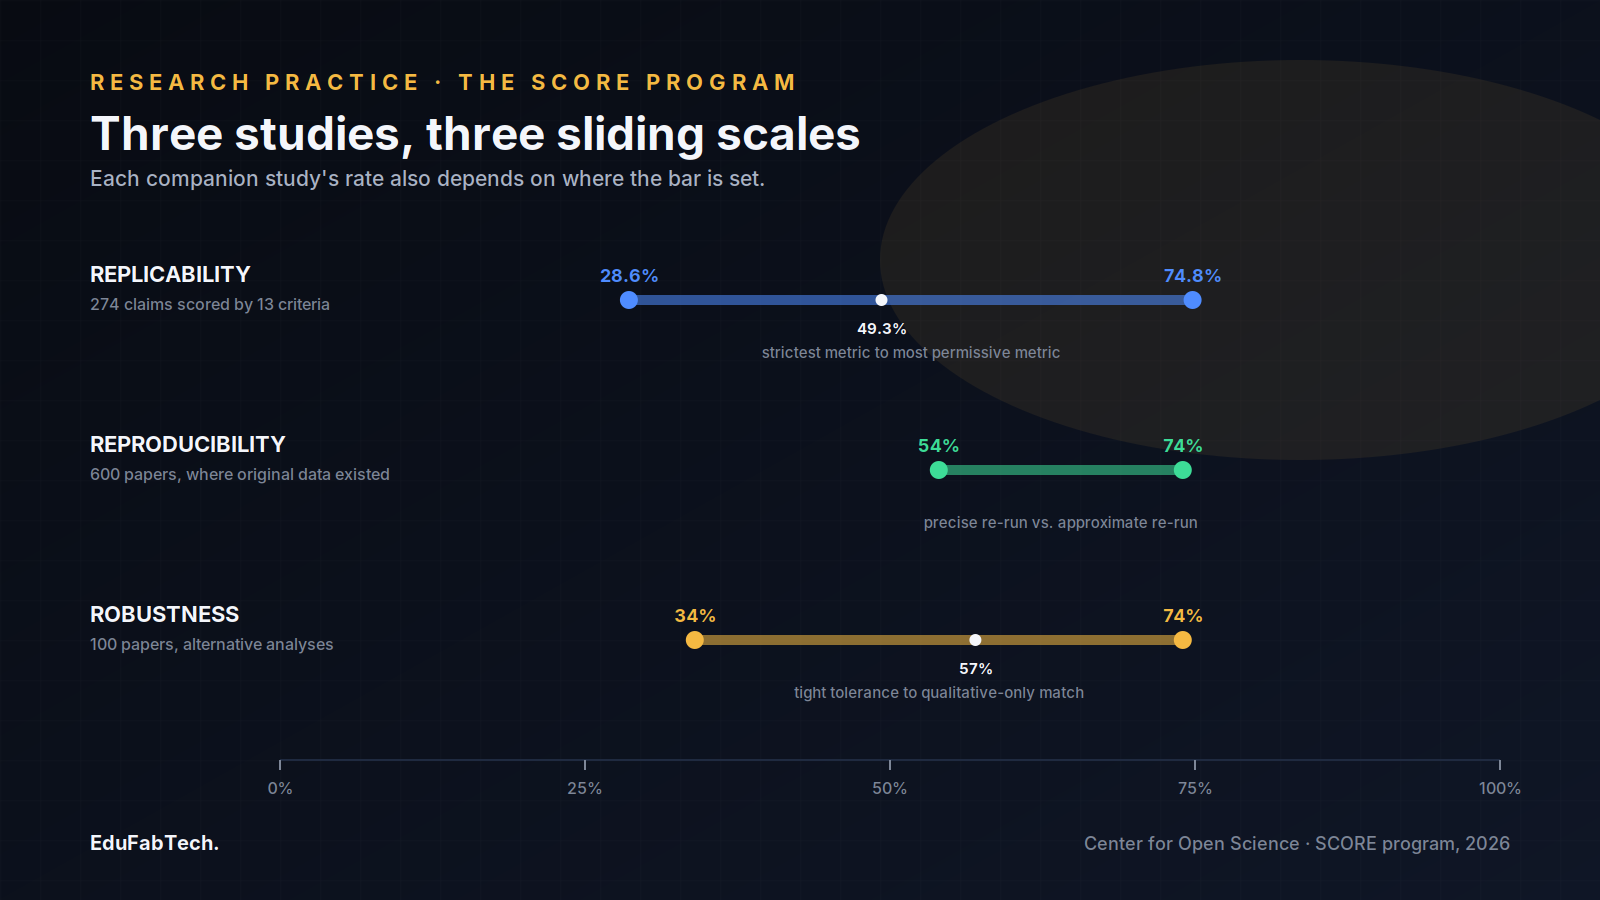
The replicability paper was one of three Nature papers to come out of the Center for Open Science's SCORE program, a Defense Advanced Research Projects Agency-funded effort that drew on 865 researchers and sampled nearly 3,900 papers published from 2009 to 2018 across 62 journals in twelve disciplines, according to the Center for Open Science's press release on the program. The other two papers asked related but distinct questions, and each produced its own version of the same lesson: the number depends on where the bar is set.
A reproducibility paper checked whether 600 papers' original analyses could be rerun on the original data. Only 24% of those papers had data available to attempt this at all. Among the papers that could be checked, 74% were judged to approximately reproduce the published result and 54% to precisely reproduce it — but when both data and code had been shared, those figures rose to 91% and 77%, and when the data had to be reconstructed from what was reported in the paper, they fell to 38% and 11%, per the same Center for Open Science summary.
A robustness paper took 100 papers and asked whether a different, equally defensible analysis of the same data would reach the same conclusion. At a tolerance of plus or minus 0.05 standard-deviation units (Cohen's d), 34% of alternative analyses landed on the same result as the original; loosen the tolerance to plus or minus 0.20, and agreement rose to 57%; judged only on whether the qualitative conclusion matched — an effect existed, in the same direction — agreement reached 74%, with 24% finding no effect and 2% finding the opposite effect, again according to the Center for Open Science's reporting on the program's findings. Three papers, three separate questions — can it be rerun, does a different analysis choice change the answer, does it hold up in new data — and three number lines that each run from roughly a quarter to three-quarters depending on where the line is drawn.
What the people behind the project say it does and does not show
Brian Nosek, the Nature paper's corresponding author and executive director of the Center for Open Science, told PsyPost that "the basic finding is that establishing the replicability of published results cannot be taken for granted," adding that "this research exposes greater uncertainty in the published literature than we might recognize." He also pushed back on the inference readers are most likely to draw from a bare success rate: "Failing to replicate a finding does not mean that the original finding is wrong," he said, pointing to the possibility of a false positive in the original study, an error in the replication, or unrecognized differences in conditions between the two studies.
Stephanie Zellers, a postdoctoral researcher at the University of Helsinki who was not involved in the study, made a related point to PsyPost about the thirteen-metrics finding specifically: "I appreciated the detailed discussion of replication metrics... Our choice of metric influences what the answer means, when we ask the question 'did this study replicate?'" She also warned against reading the result as social science being "only 'correct' about half of the time," arguing instead that "rather we should focus on the total body of evidence for a claim and critically evaluate uncertainty in the evidence alongside the context and boundaries of the effect."
Questions worth asking before trusting a replication number
None of this means a replication rate is meaningless — it means the number is incomplete without its definition attached. Before treating a reported replication, reproducibility or robustness rate as settled, the SCORE program's own structure suggests a short checklist:
- Which question was asked: can the original analysis be rerun on the original data (reproducibility), does an alternative analysis of the same data change the conclusion (robustness), or does an independent new sample confirm the effect (replicability)? These are not interchangeable, and the same paper can score very differently on each.
- Which success criterion defined "yes": statistical significance in the same direction, an effect-size overlap test, an equivalence test with a pre-set tolerance, or a meta-analytic pooling method? Each answers a different question, as the PLOS ONE re-analysis sets out.
- Was the check adequately powered to detect the original effect size, and if so, how did the measured effect size in the new attempt compare with the original — not just whether it cleared a significance threshold?
- If a tolerance band was used to judge "the same result," how wide was it, and would the conclusion survive a tighter or looser one? The SCORE robustness paper's own results moved from 34% to 74% depending on exactly this choice.
- Did the original data and code exist and get shared? The Center for Open Science's reproducibility figures show that availability alone separated a 91% success rate from a 38% one.
The SCORE program's own conclusion, visible in the design choice to report thirteen numbers rather than one, is that no single success metric has been accepted in the methodological literature as the correct one for every purpose. That is not a shortcoming of the project. It is the project's main finding, and it applies to any replication, reproducibility or robustness claim a reader encounters afterward, including the ones compressed into a single figure in a headline.
A quick question for readers
When an article cites a study, do you open the source?
Every claim on this site links to a primary source. We want to know whether readers actually follow those links, or whether they …
Pick an answer, create a free account in a minute, and your vote counts. Already a member? Sign in
Comments 2
Comment-
The part that actually lands for me is the effect-size number, not the pass/fail tally. Median r went from 0.25 in the originals to 0.10 in…
-
The part that'd stick with me is the effect-size collapse, not the pass/fail percentage: median r going from 0.25 in the originals to 0.10 i…
Join free to read the full comments and reply Comments are between members; an account takes a minute.
Source: Nature
Sources (5)
- Andrew H. Tyner, Anna Lou Abatayo, Mason Daley, Brian A. Nosek et al.. Investigating the replicability of the social and behavioural sciences. Nature, 2026. nature.com ↗ · checked 30 Oct 2026
- Robbie C. M. van Aert, Marcel A. L. M. van Assen, Rubén López-Nicolás. Evaluation of replication success: A statistical perspective and extended analysis of the SCORE data. PLOS ONE, 2026. journals.plos.org ↗ · checked 30 Oct 2026
- Center for Open Science. Large-Scale Collaboration Releases New Findings on Research Credibility. Center for Open Science, 2026. cos.io ↗ · checked 30 Oct 2026
- Eric W. Dolan. Only about half of social science findings held up when retested, major replication project finds. PsyPost, 2026. psypost.org ↗ · checked 30 Oct 2026
- Earth.com. Researchers attempted to replicate findings from 274 science journal papers, but only half could be successfully reproduced. Earth.com, 2026. earth.com ↗ · checked 30 Oct 2026